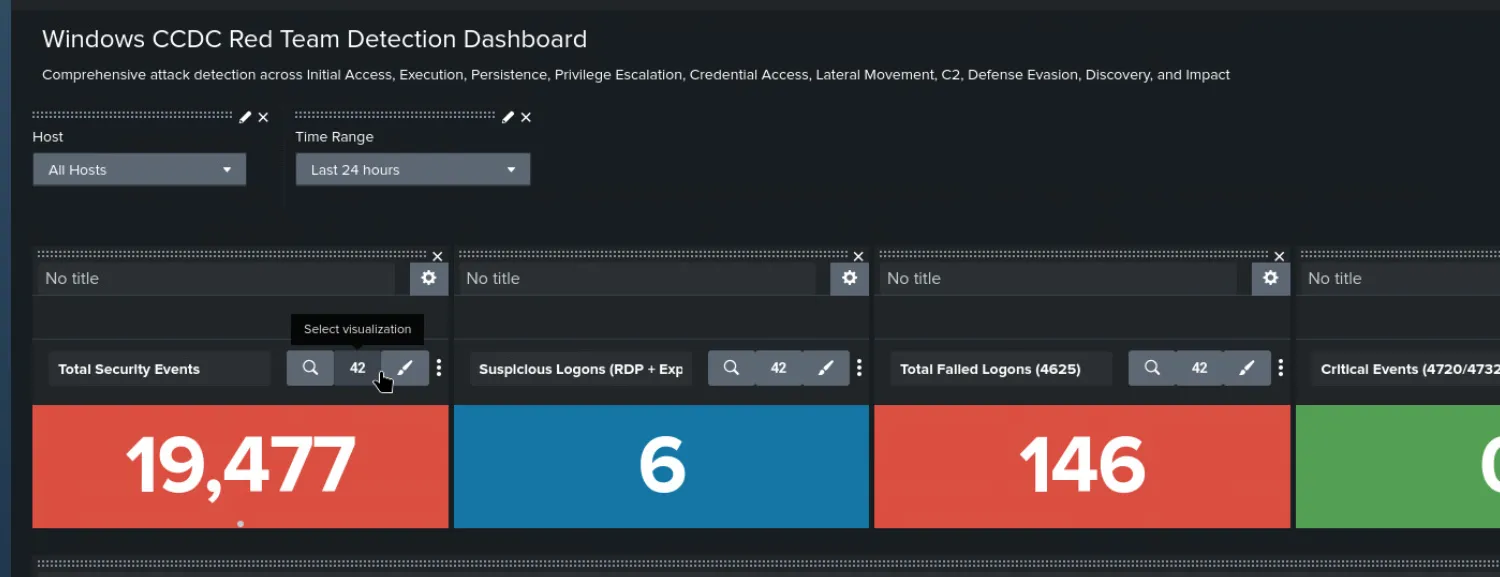
A lightweight, local SOC dashboard designed for CCDC (Collegiate Cyber Defense Competition). This tool receives Splunk Webhooks and displays security alerts in a clean, filterable web interface, allowing teams to monitor attacks without external internet access.
🚀 Setup Guide
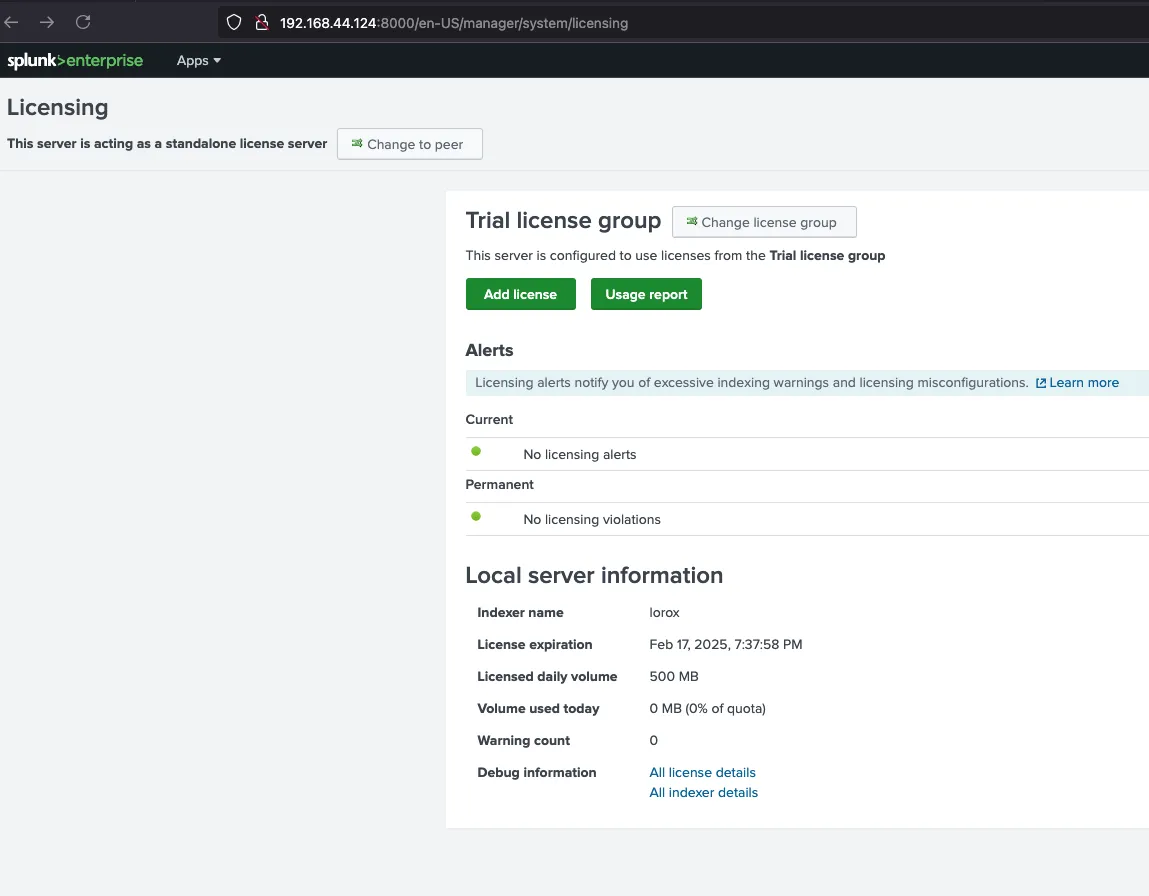
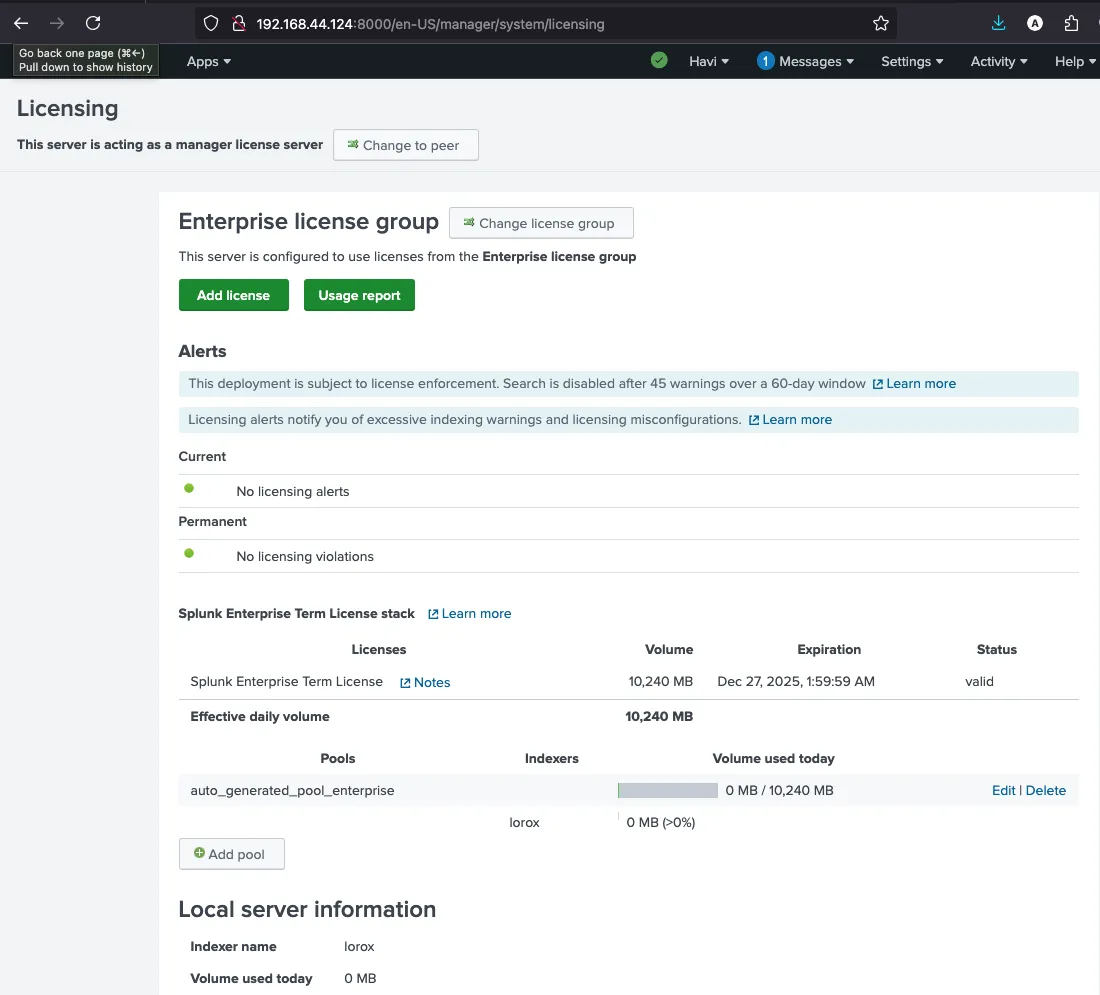
Step 1: Add License
Before using Splunk, you need to add a valid license to enable all features.
Step 2: Configure Data Forwarding
Set up data forwarding to collect logs from your systems and send them to Splunk for monitoring.
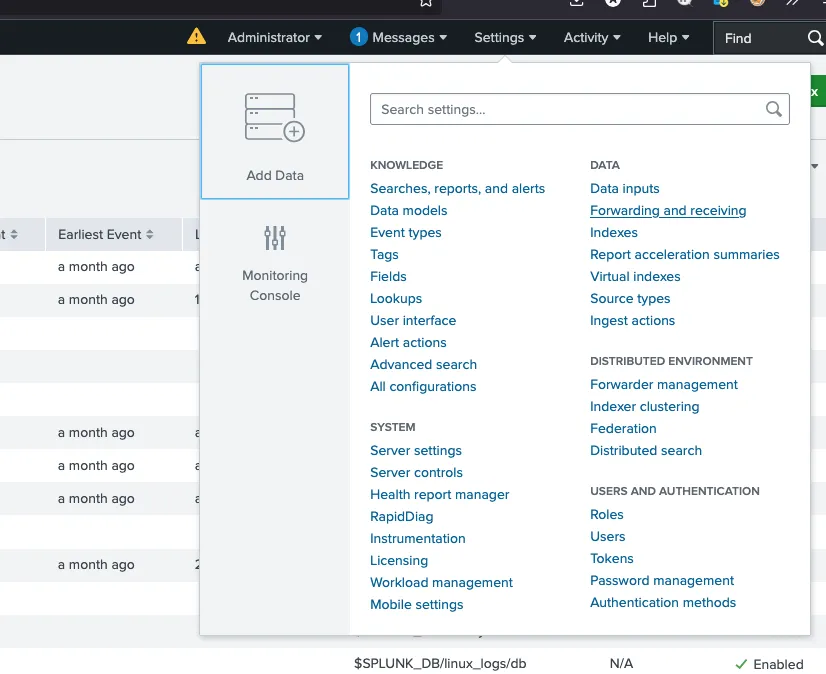
Add Data
Navigate to Settings and select "Add Data" to begin configuring your data sources.
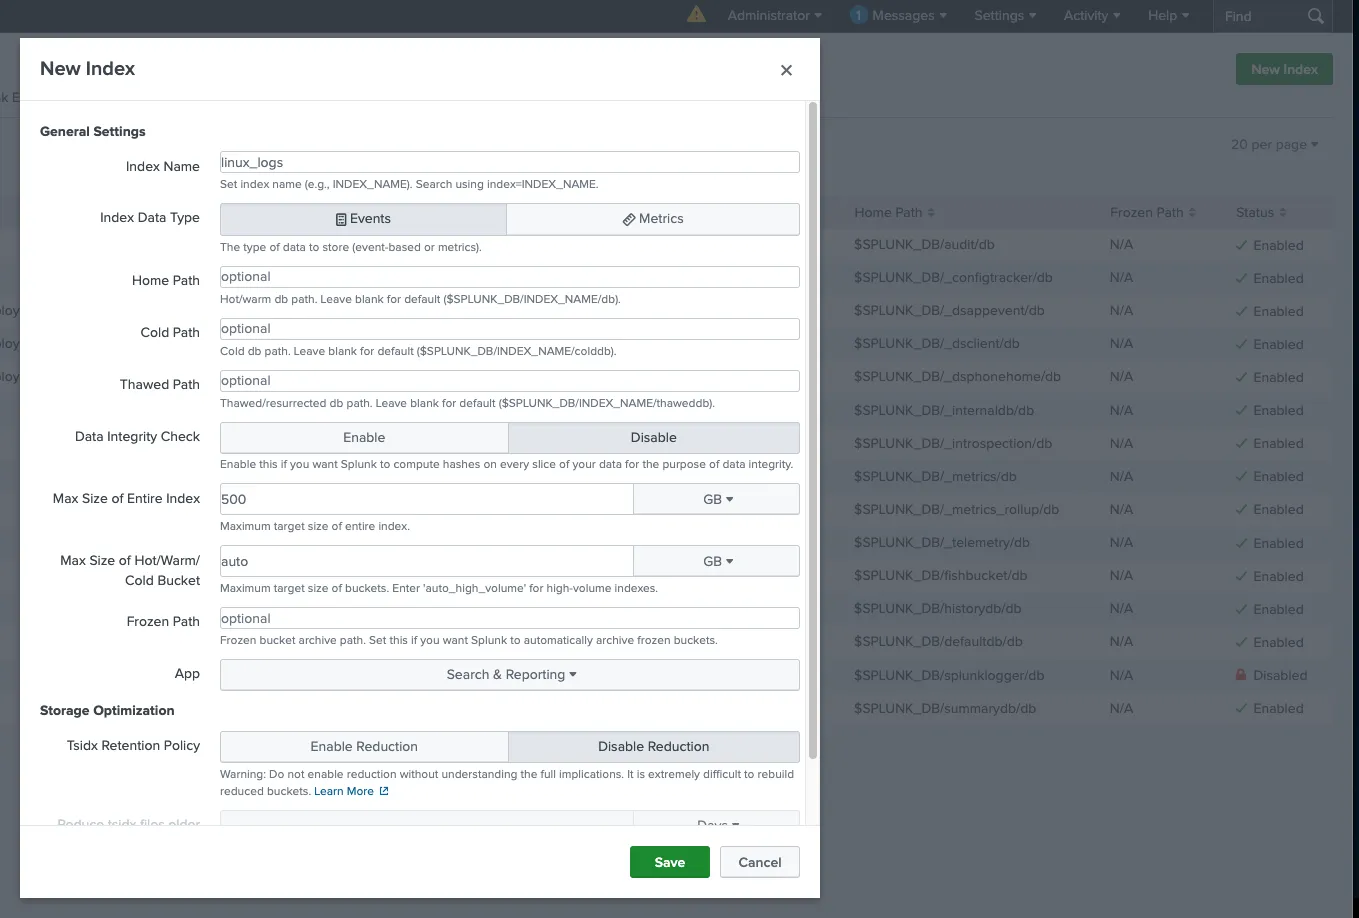
Create Log Source
Configure the log source you want to monitor. This could be system logs, application logs, or security event logs.
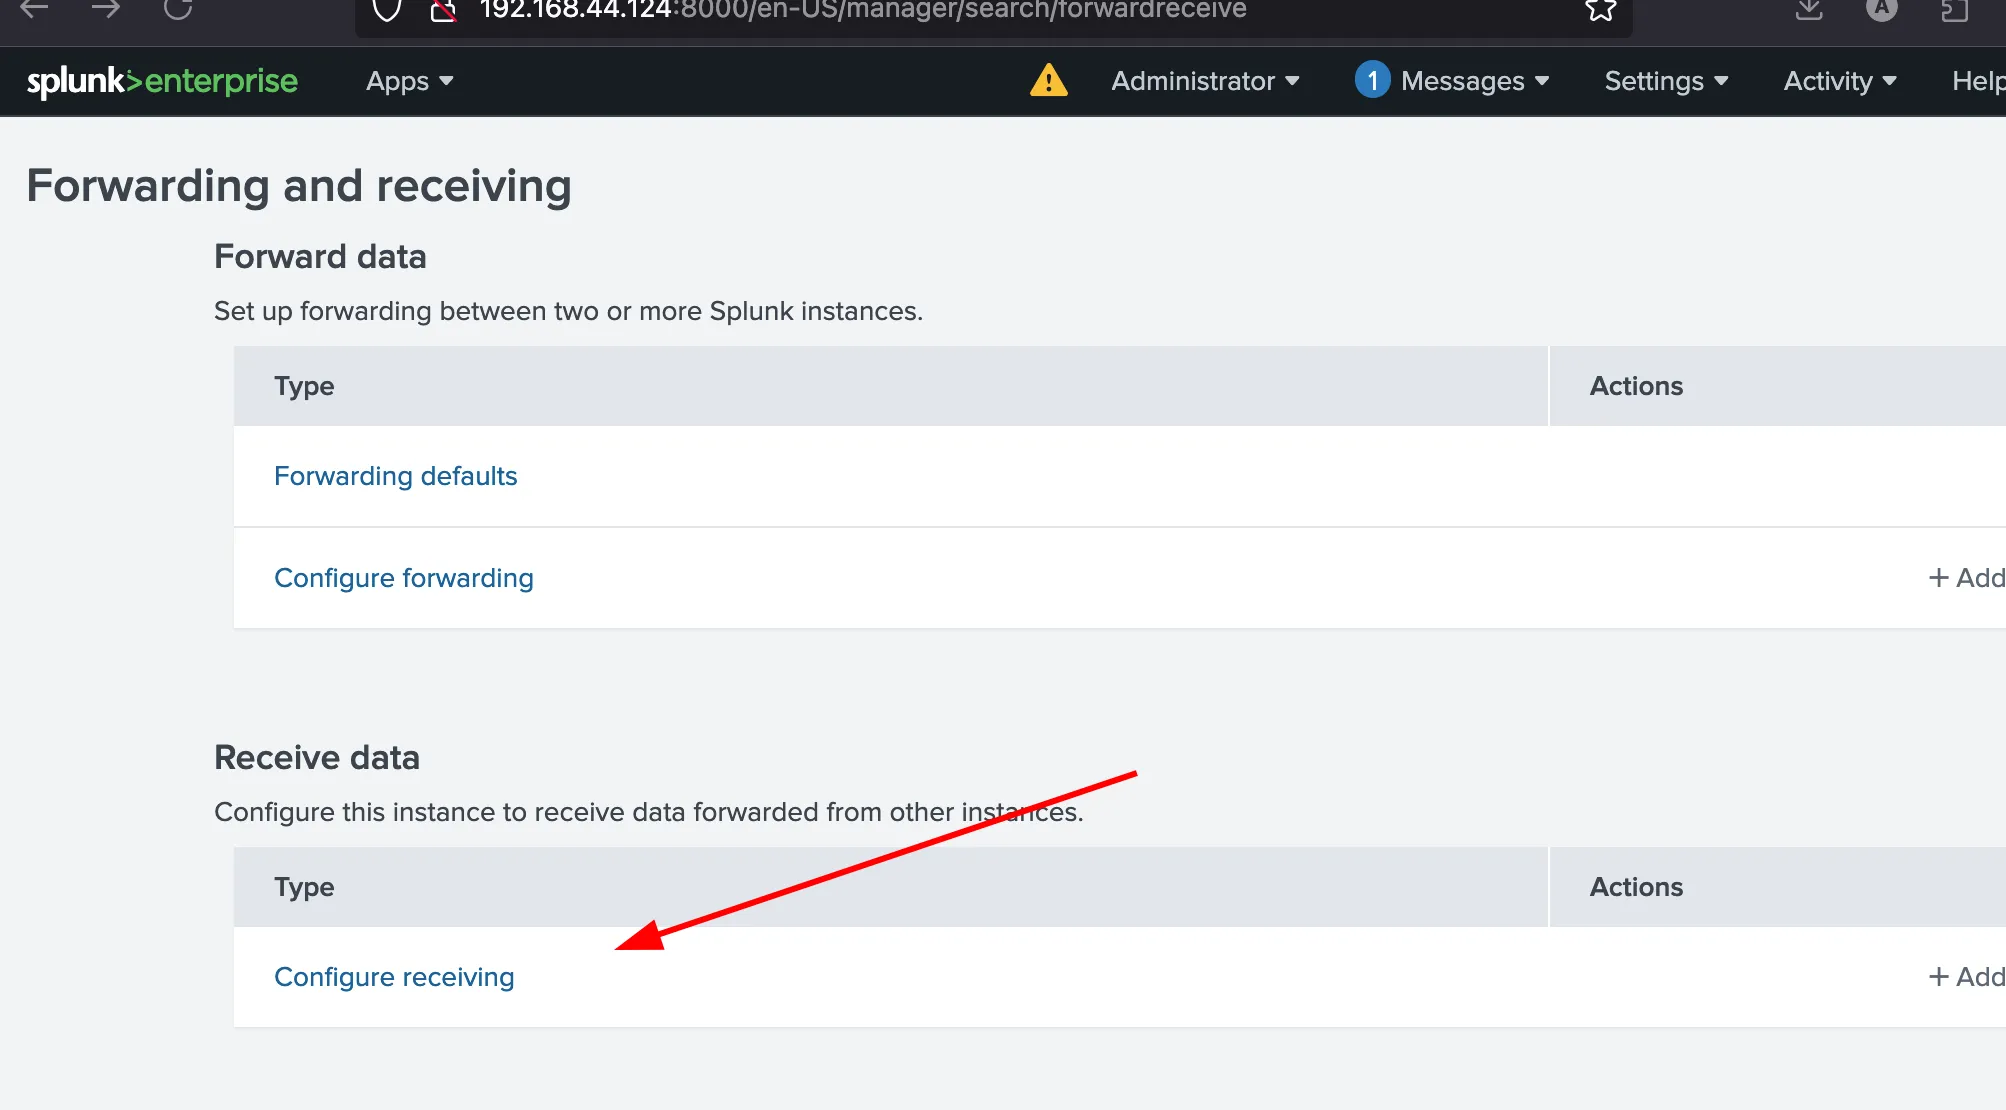
Configure Receiving
Set up the receiving port to accept data from forwarders. This allows Splunk to receive logs from remote systems.
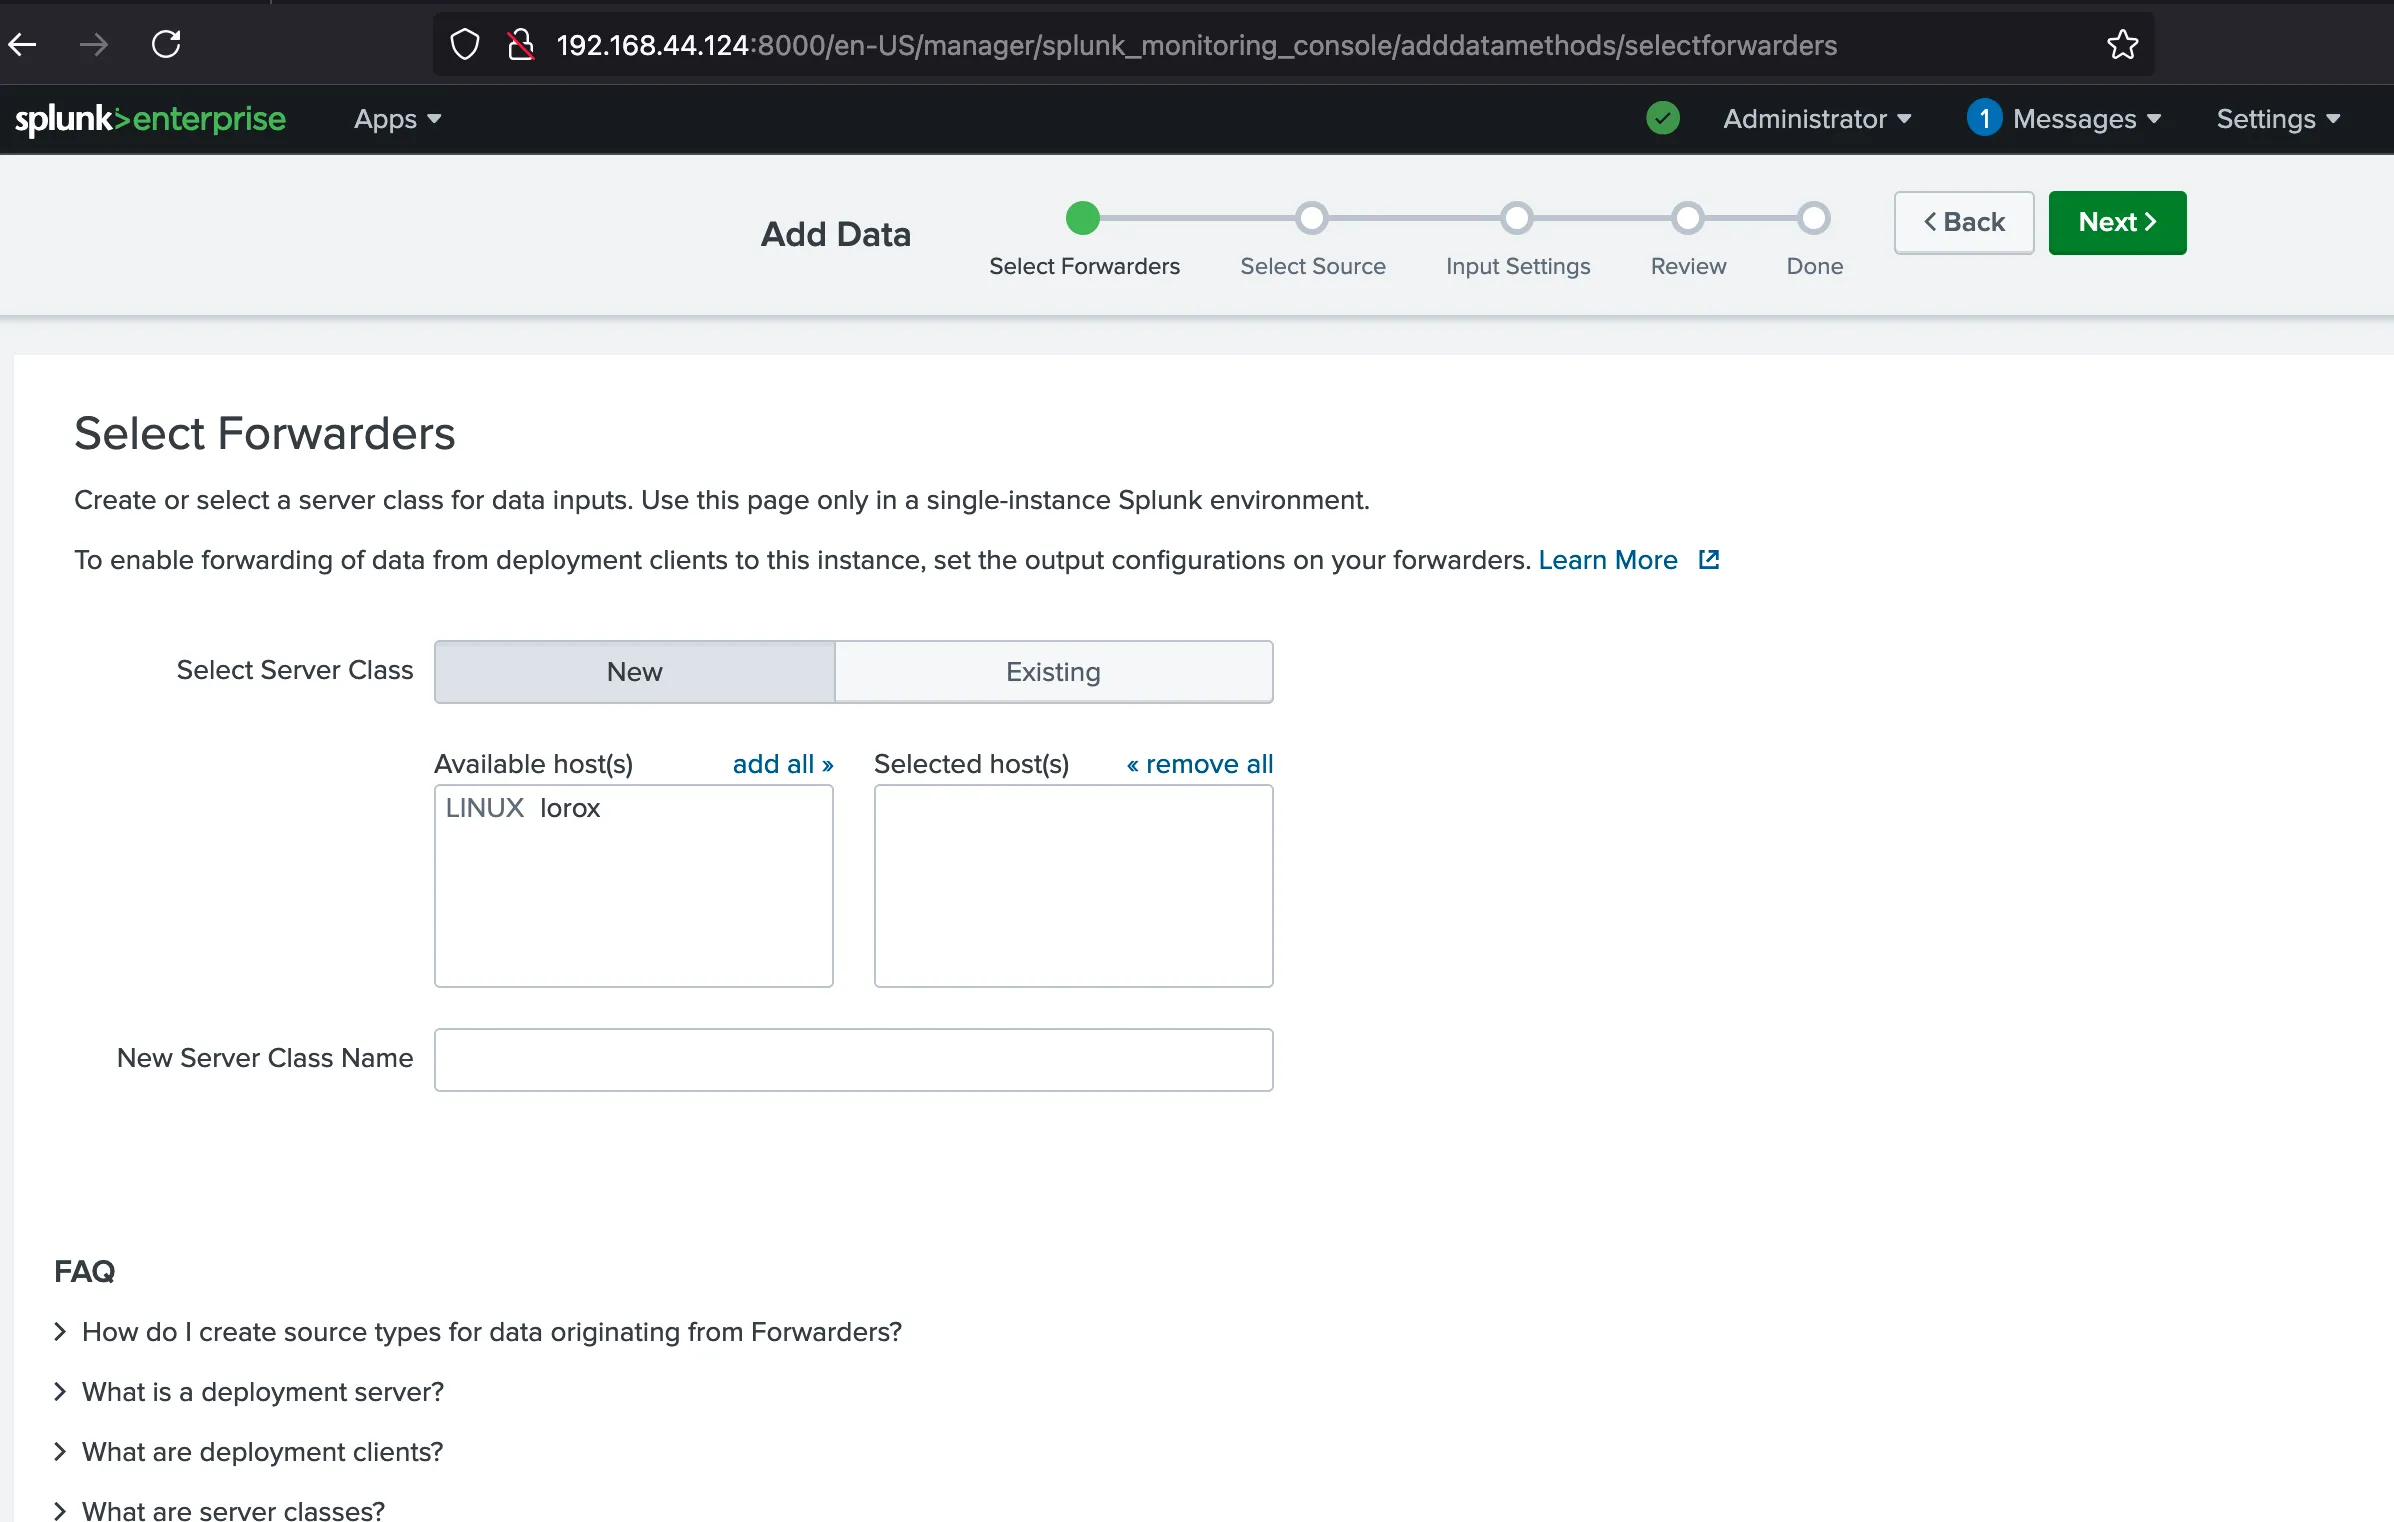
Select Forwarders
Choose which forwarders will send data to your Splunk instance. This determines which systems' logs will be collected.
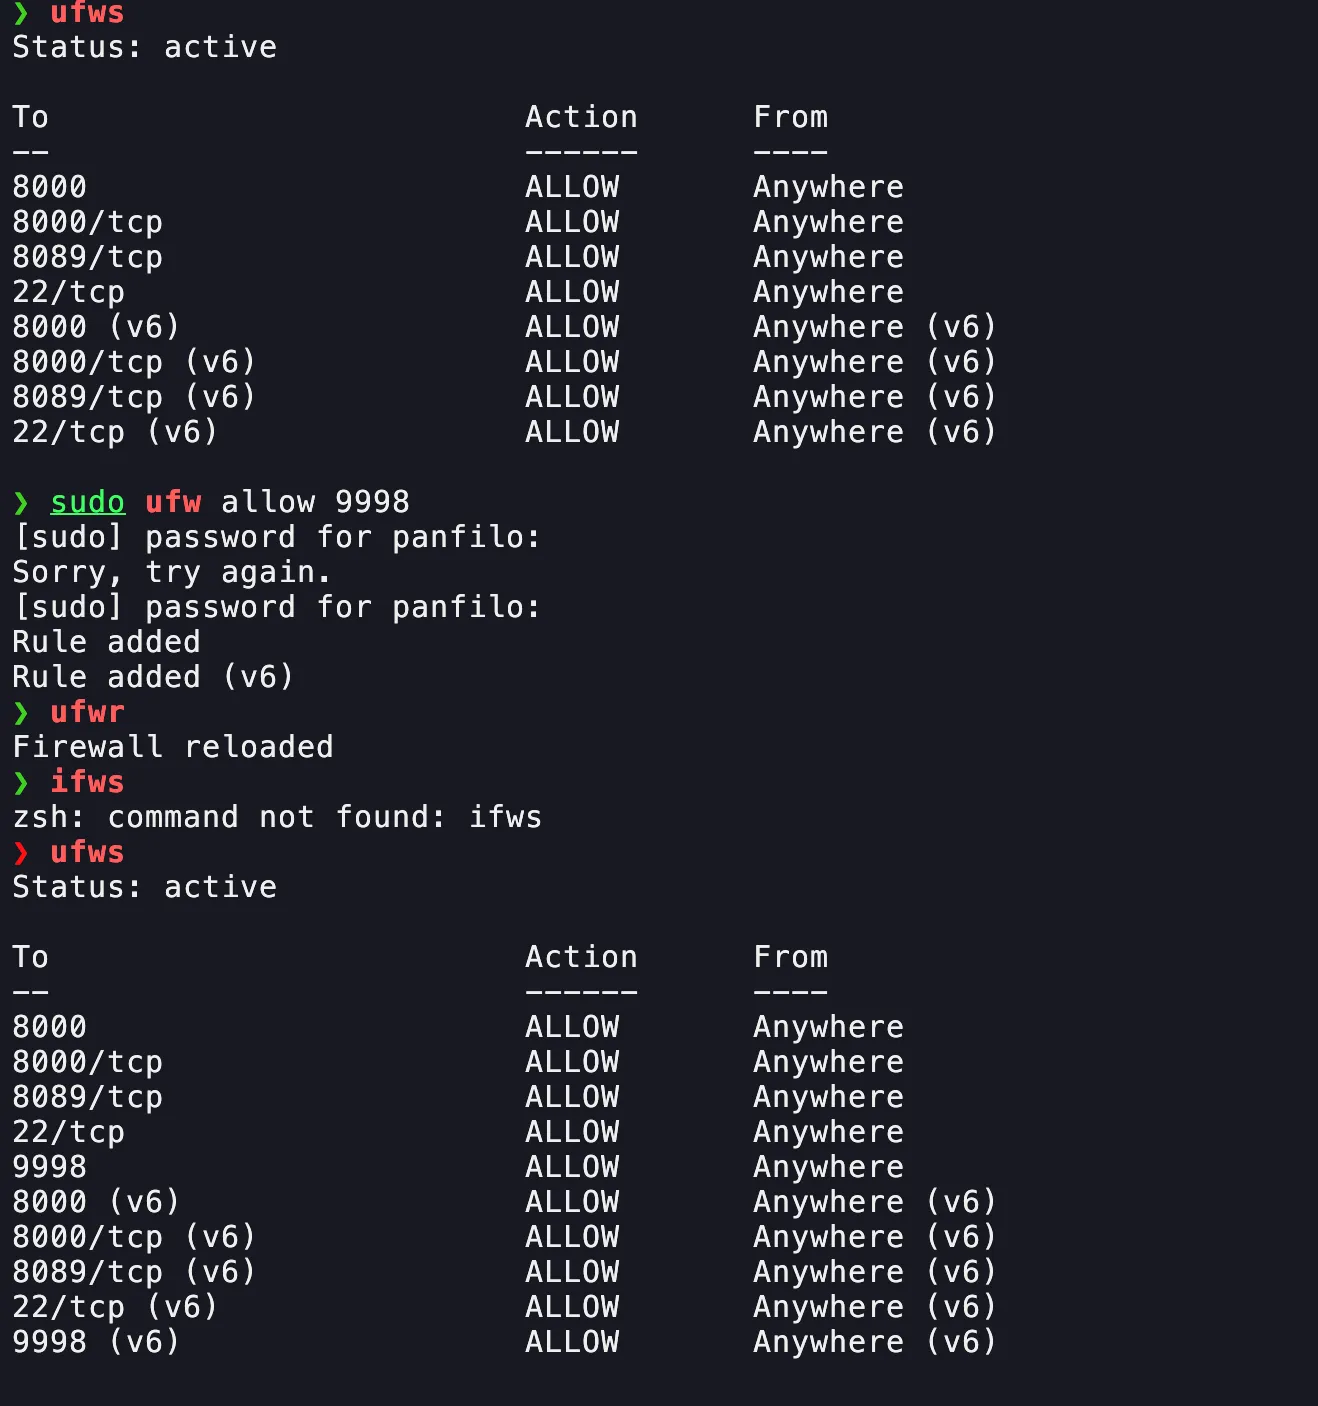
Verify Firewall Configuration
Ensure that the firewall is open to allow communication between forwarders and Splunk. Check that the receiving port is accessible.
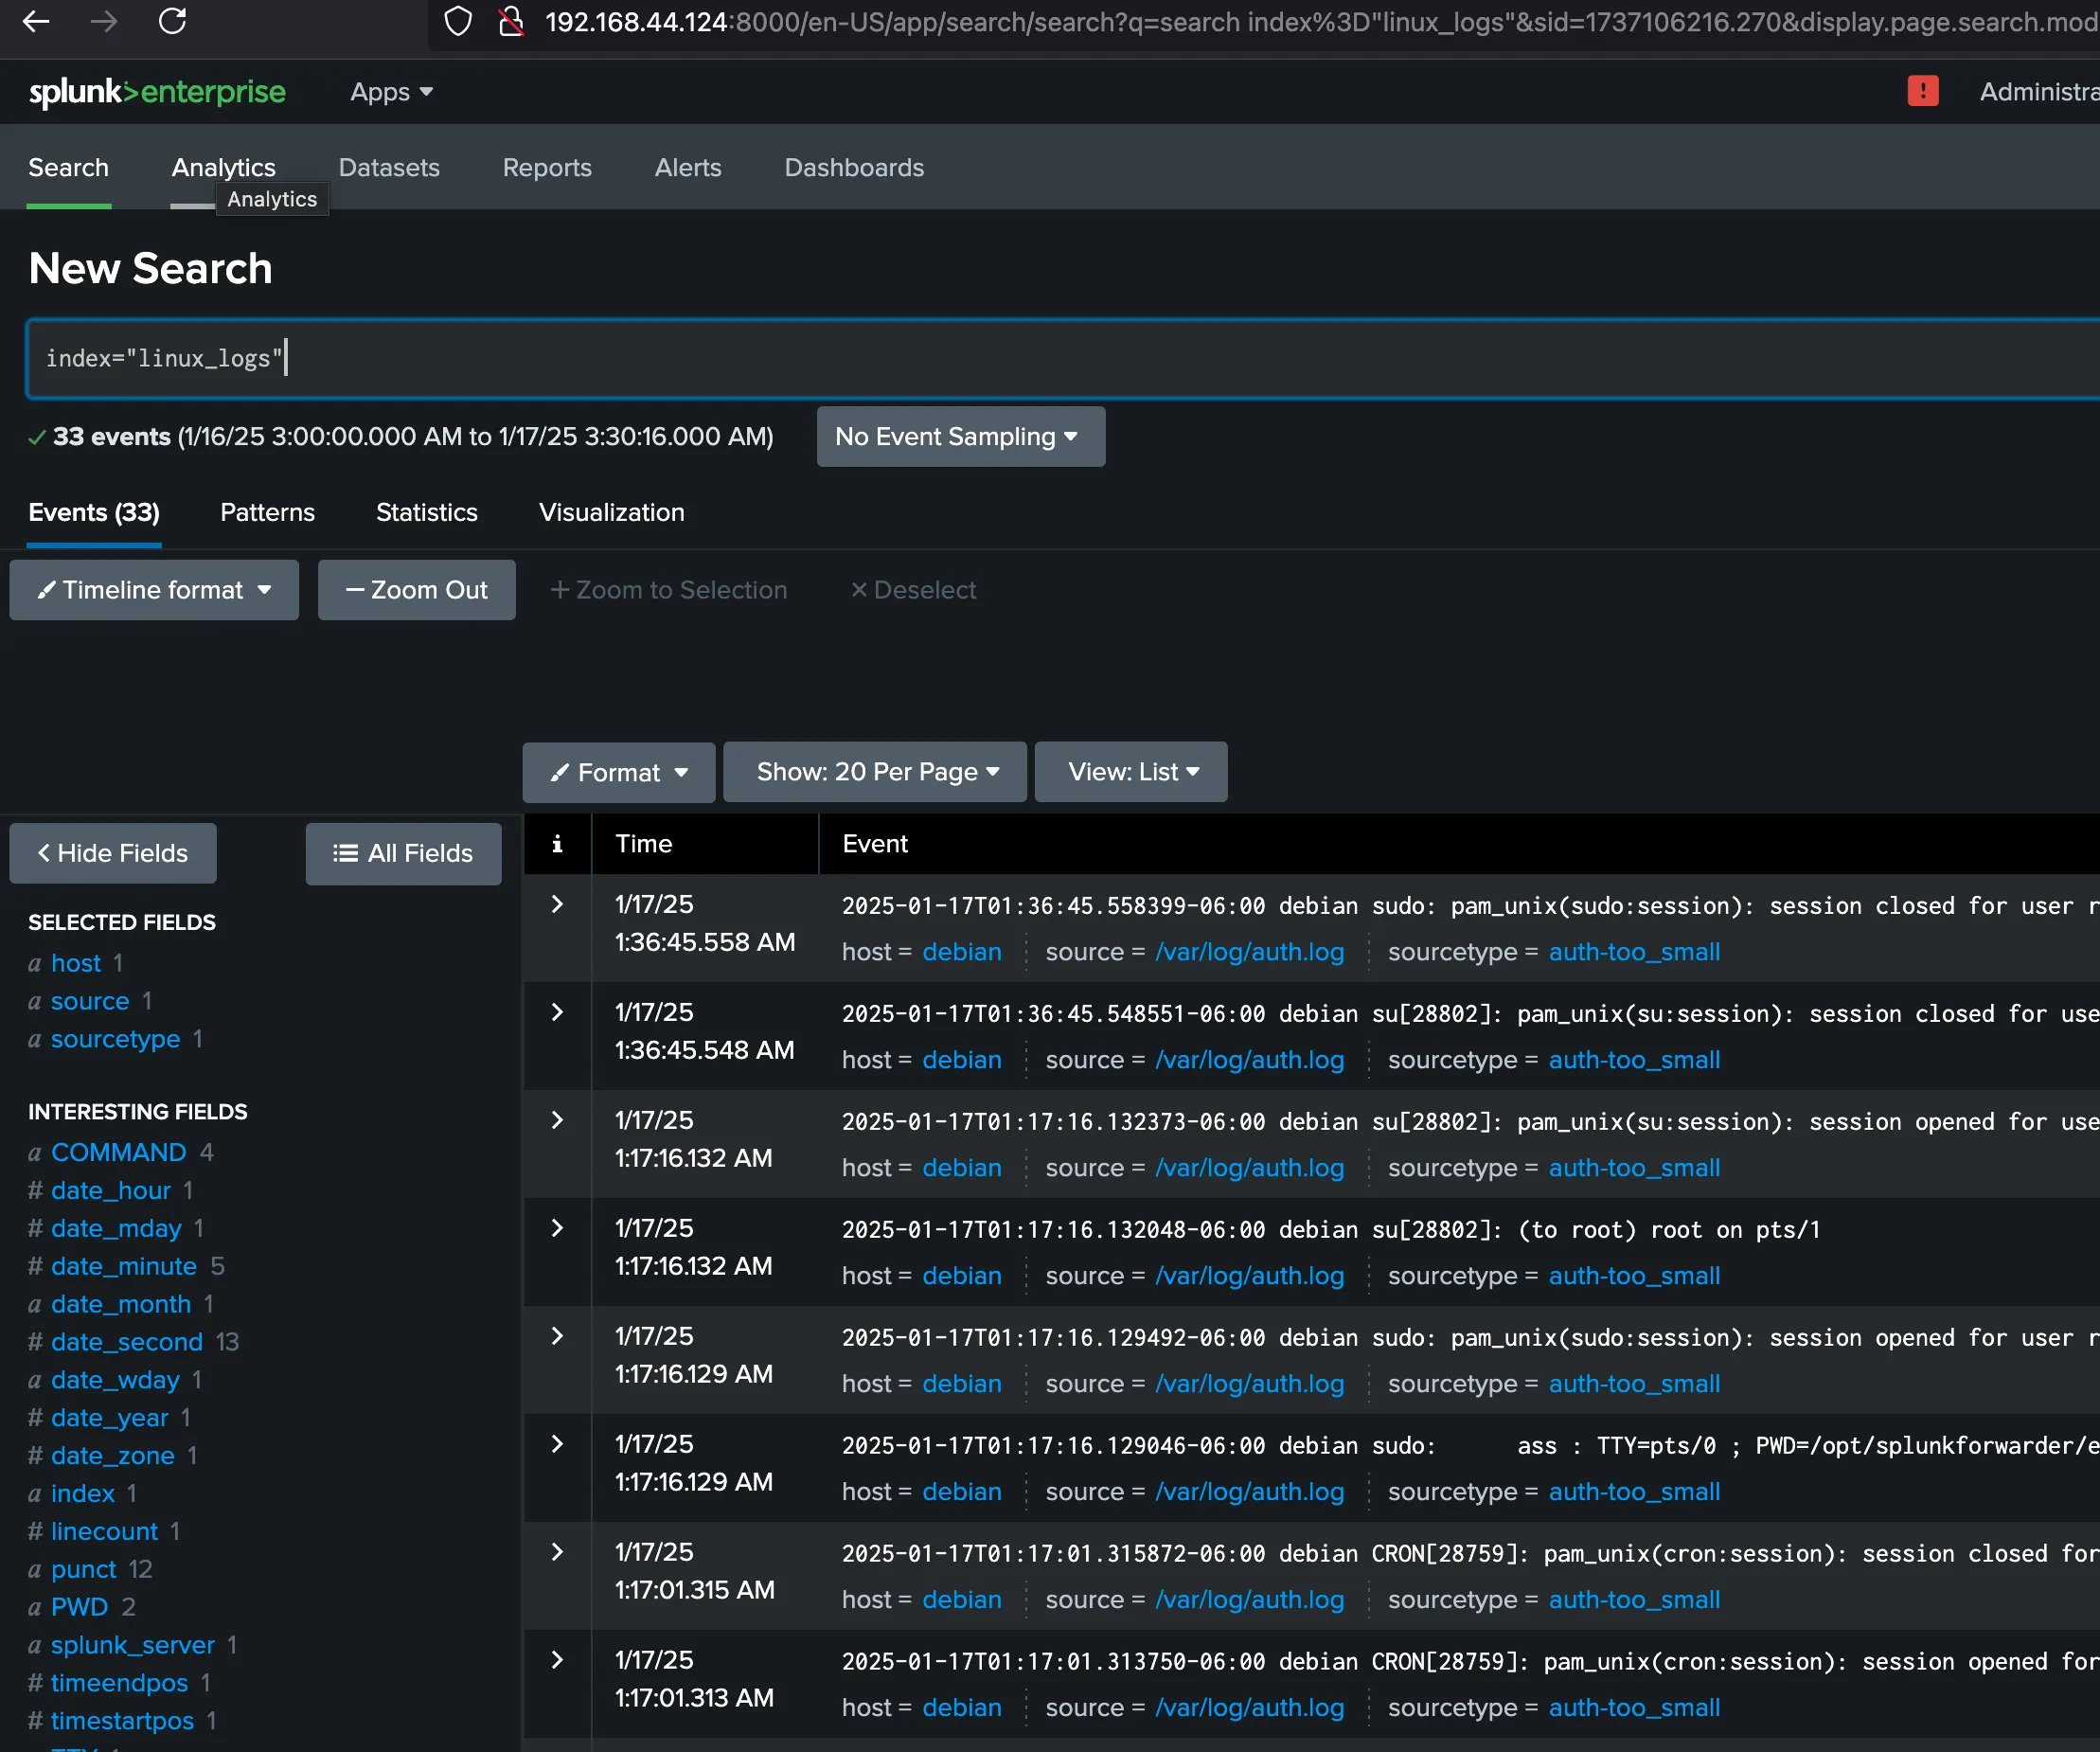
View Linux Logs
Once configured, you can view the incoming Linux logs in Splunk's search interface to verify data is being received correctly.
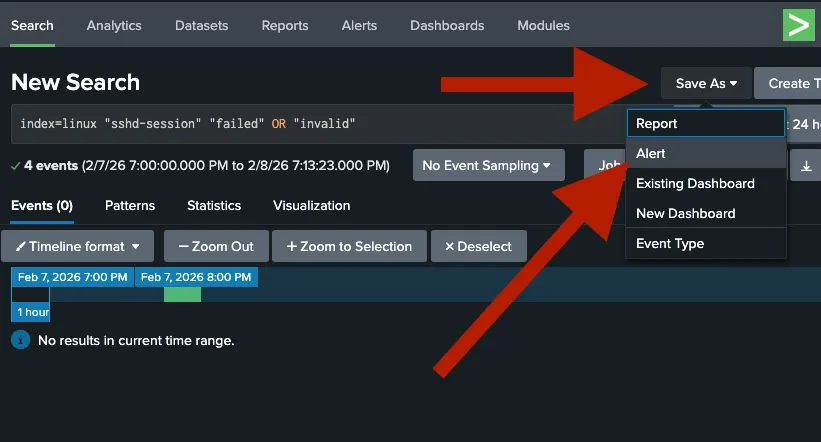
Step 3: Create the Splunk Search
Run a search in Splunk to identify the specific activity you want to monitor. For example, to track failed SSH logins:
index=linux "sshd-session" "failed" OR "invalid"Step 4: Save as Alert
Once your search is working, save it as an alert to automate the notification process.
- Click on Save As in the top-right corner.
- Select Alert.
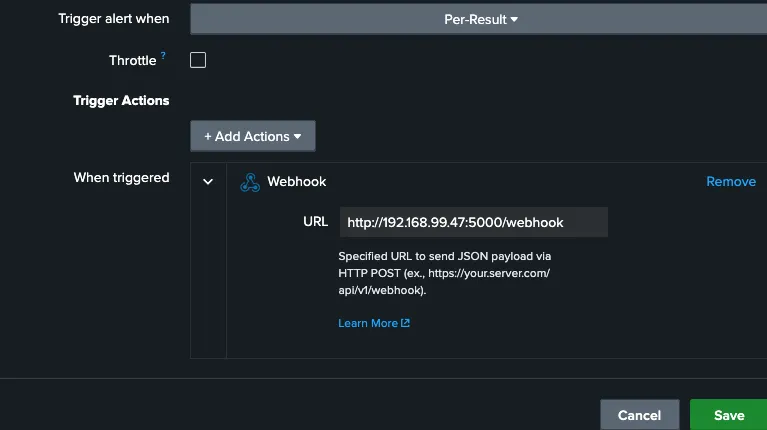
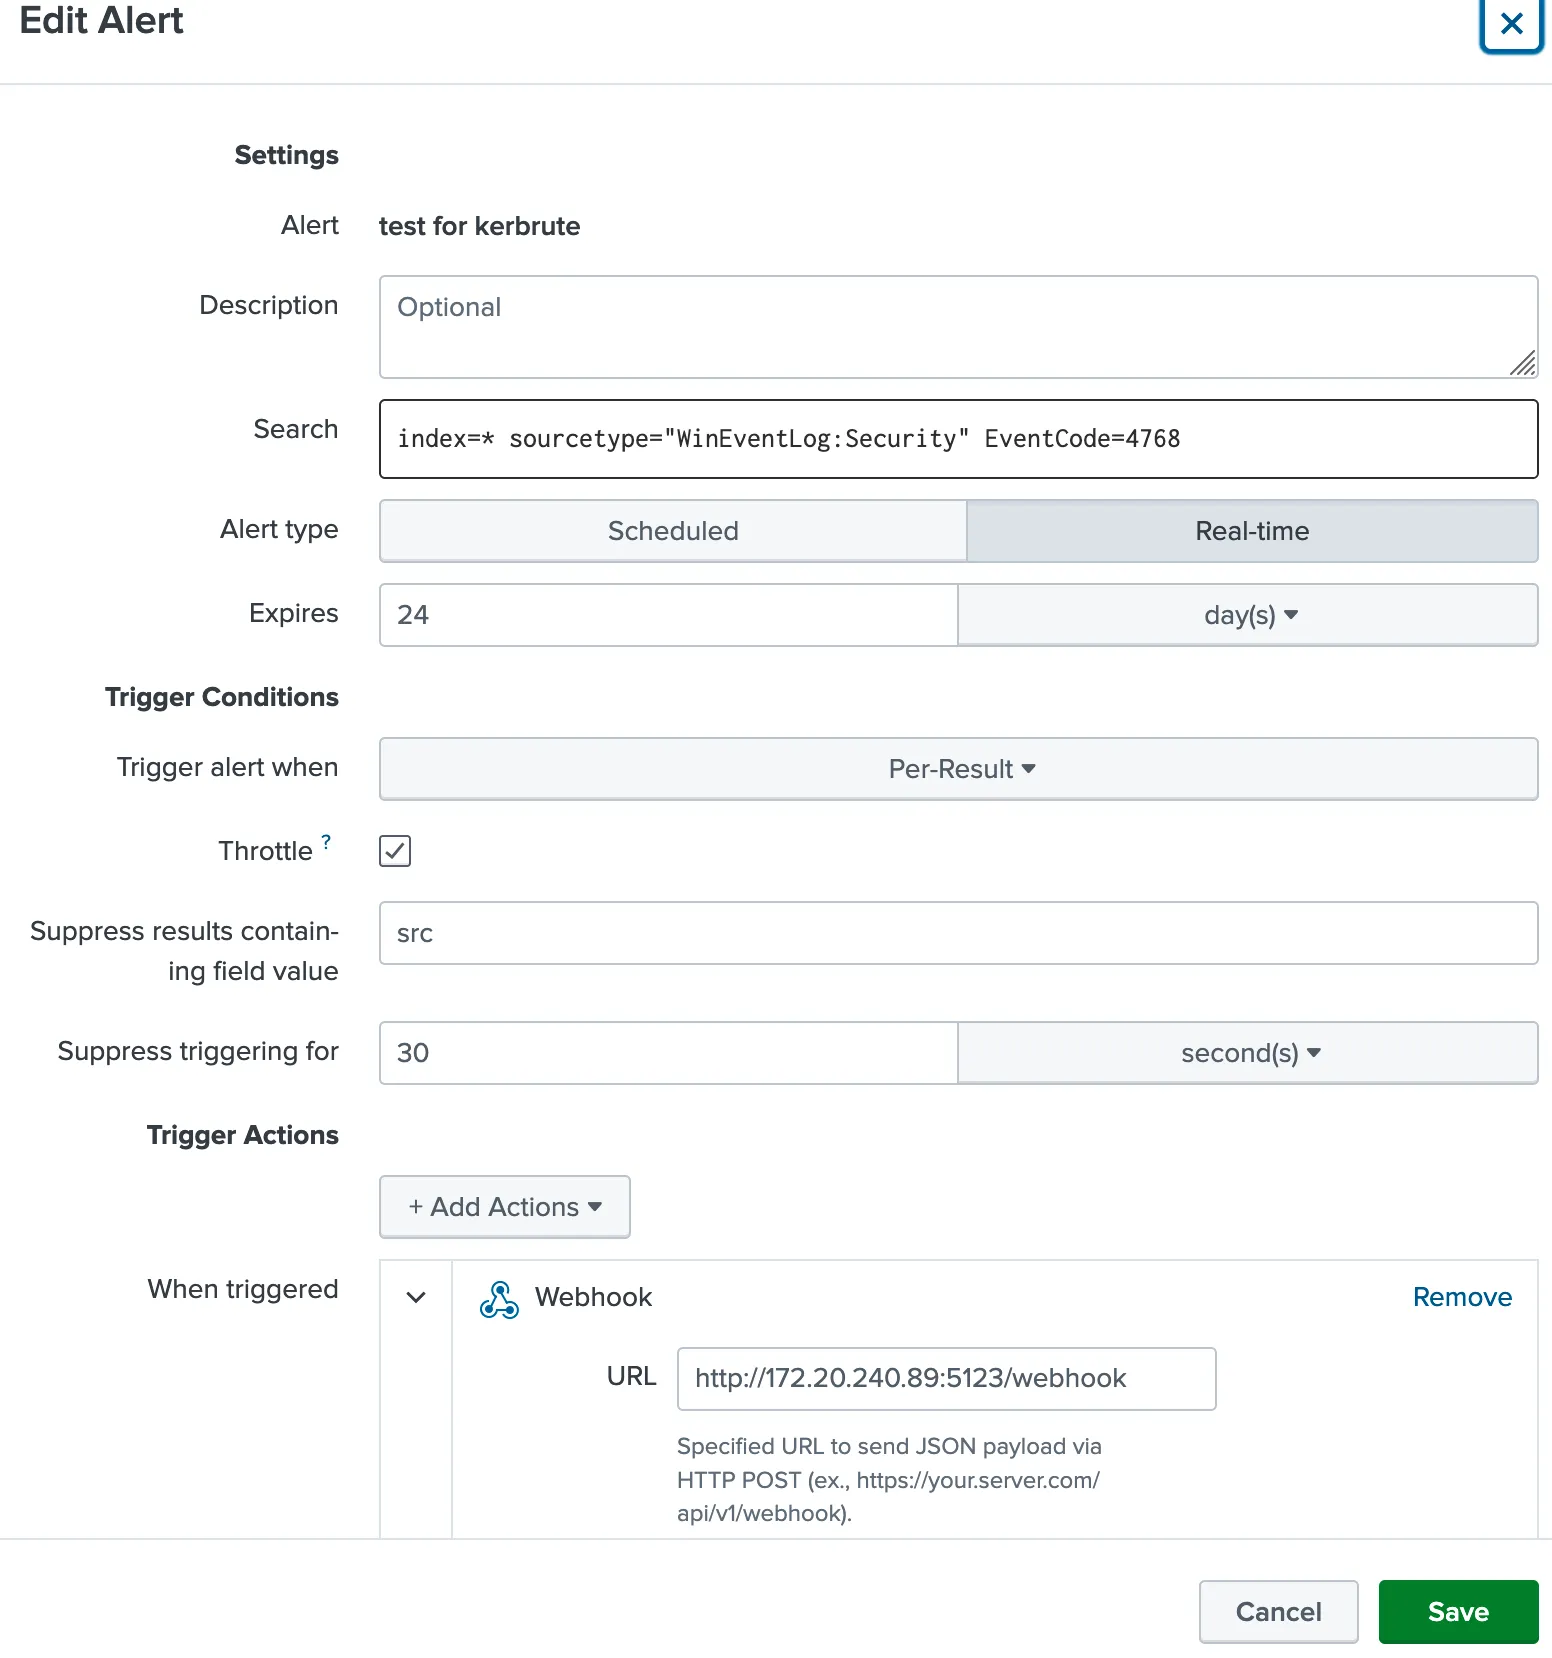
Step 5: Configure Webhook Action
In the Alert settings, you must tell Splunk to send the data to your dashboard's IP address.
- Under Trigger Actions, click Add Action.
- Select Webhook.
- Enter your dashboard URL:
http://<YOUR_IP>:5000/webhook
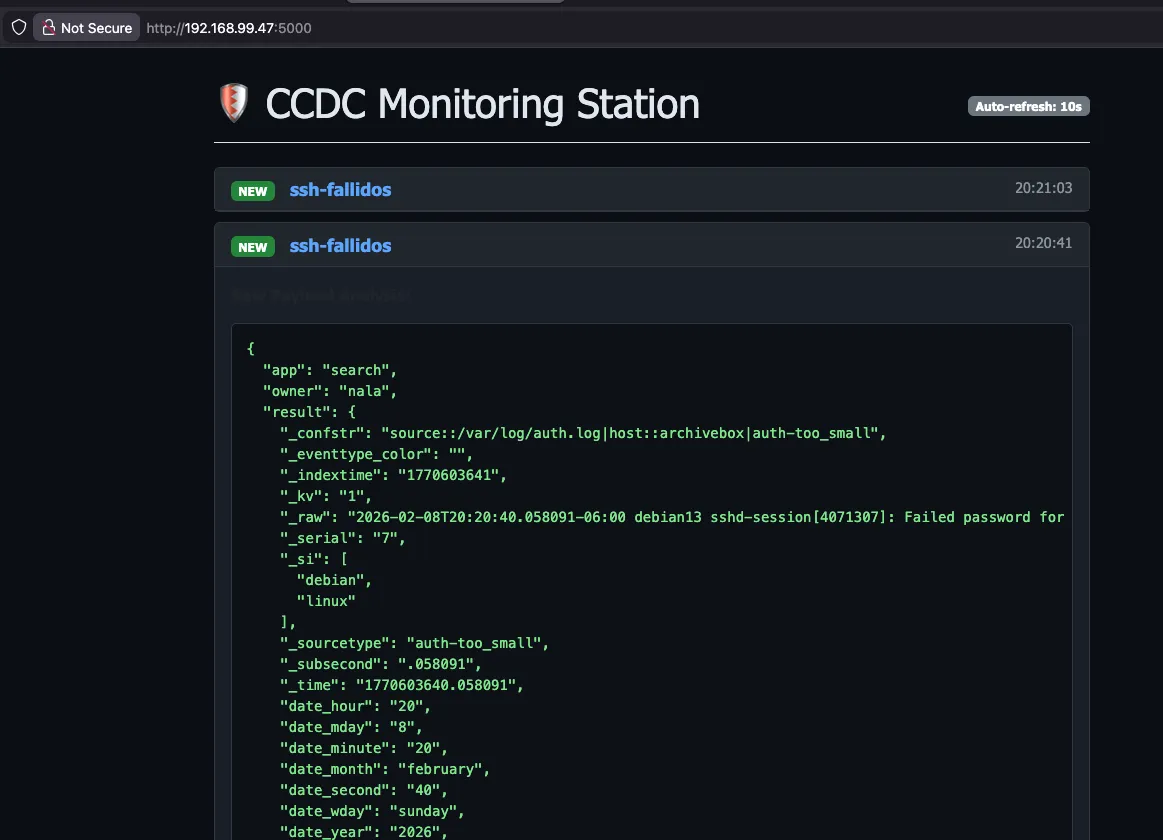
Step 6: Launch the Dashboard
On your monitoring station, ensure you have Flask installed and run the server script.
# Install dependencies
pip install flask

# Start the listener
python3 website.py
Now, open your browser and navigate to http://localhost:5000 to see your live
attack feed.
🛠️ Requirements
- Splunk Enterprise (Local or VM)
- Python 3.x
- Flask
💡 Competition Tip
Remember to enable Throttling in the Splunk alert settings to prevent the Red Team from flooding your dashboard with thousands of messages during a brute-force attack!
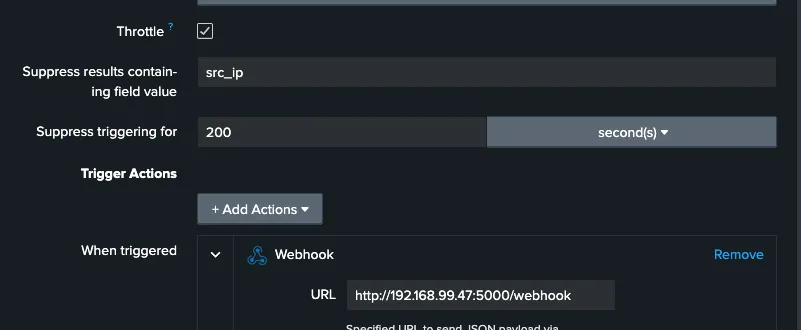
⚙️ Configuring Alert Throttling
Suppress results containing field value
Enter src_ip.
Why? This tells Splunk: "If I get 500 failures from the same IP address, only send me one alert. But if a different IP address starts attacking, send me a new alert immediately."
Suppress triggering for
Enter 60 and select second(s) (or 300 seconds / 5
minutes).
Why? This is your "cool-down" period. Once an alert triggers for a specific IP, Splunk will wait this long before notifying you about that same IP again.
🔐 Enabling Kerberos Audit Logs (Windows)
To monitor Kerberos authentication activity on Windows systems, you need to enable auditing for Kerberos events. This allows Splunk to capture authentication attempts and ticket operations.
Enable Kerberos Logging
Run the following commands in PowerShell (as Administrator):
auditpol /set /subcategory:"Kerberos Authentication Service" /success:enable /failure:enable
auditpol /set /subcategory:"Kerberos Service Ticket Operations" /success:enable /failure:enable
What this does:
- Enables logging for both successful and failed Kerberos authentication attempts
- Captures Kerberos service ticket operations (TGS requests)
- Logs are written to the Windows Security Event Log
Verify Configuration
To confirm that Kerberos auditing is enabled, run:
auditpol /get /subcategory:"Kerberos Authentication Service"Expected output:
Kerberos Authentication Service Success and FailureIf you see Success and Failure, the audit policy is correctly configured and
Kerberos events will now be logged.
🎯 Example: Detecting Kerberos User Enumeration
Once Kerberos logging is enabled, you can create alerts to detect suspicious authentication activity. One common attack technique is Kerberos user enumeration, where attackers attempt to discover valid usernames by requesting Kerberos tickets.
Create the Alert
Use the following Splunk search to detect Kerberos authentication attempts (Event ID 4768):
index=* sourcetype="WinEventLog:Security" EventCode=4768What this detects:
- EventCode 4768 = Kerberos Authentication Ticket (TGT) was requested
- Useful for identifying user enumeration attempts
- Can reveal brute-force attacks or reconnaissance activity
Follow the same steps outlined in the Setup Guide to save this as an alert and configure the webhook to your dashboard.
Pro Tip: Combine this with throttling by Account_Name to avoid
alert spam during legitimate authentication bursts!