The Journey to Remote GPU Monitoring
The Challenge
While training an object detection model on a remote Linux server located in another country, I faced a critical challenge: how to effectively monitor GPU utilization during the training process. The traditional approach was far from ideal:
ssh -t serverGPU 'watch -n 0.5 nvidia-smi'
Relying on a persistent SSH session was cumbersome and limited my ability to monitor the training process effectively.
The Solution
I developed a lightweight agent that runs on the server, providing real-time GPU metrics through a simple REST API. The initial implementation was straightforward but effective:
curl http://192.168.44.34:3001/status

[{"name":"NVIDIA GeForce RTX 3070","utilization":"0%","memory":"18MiB / 8192MiB","power":"11.02W / 240.00W"}]
This simple API endpoint provided the foundation for what would become a full-featured monitoring application.
The Evolution
Recognizing the potential for a more user-friendly solution, I transformed this simple agent into a comprehensive monitoring application. The result is a beautiful, intuitive interface that makes remote GPU monitoring both efficient and accessible.
Final Setup
The final step was simple: I created a service on the machine to start automatically. Now, whenever I run my app on my Mac, I can see the GPU monitor working with each OpenGUI request, making remote monitoring seamless and efficient.
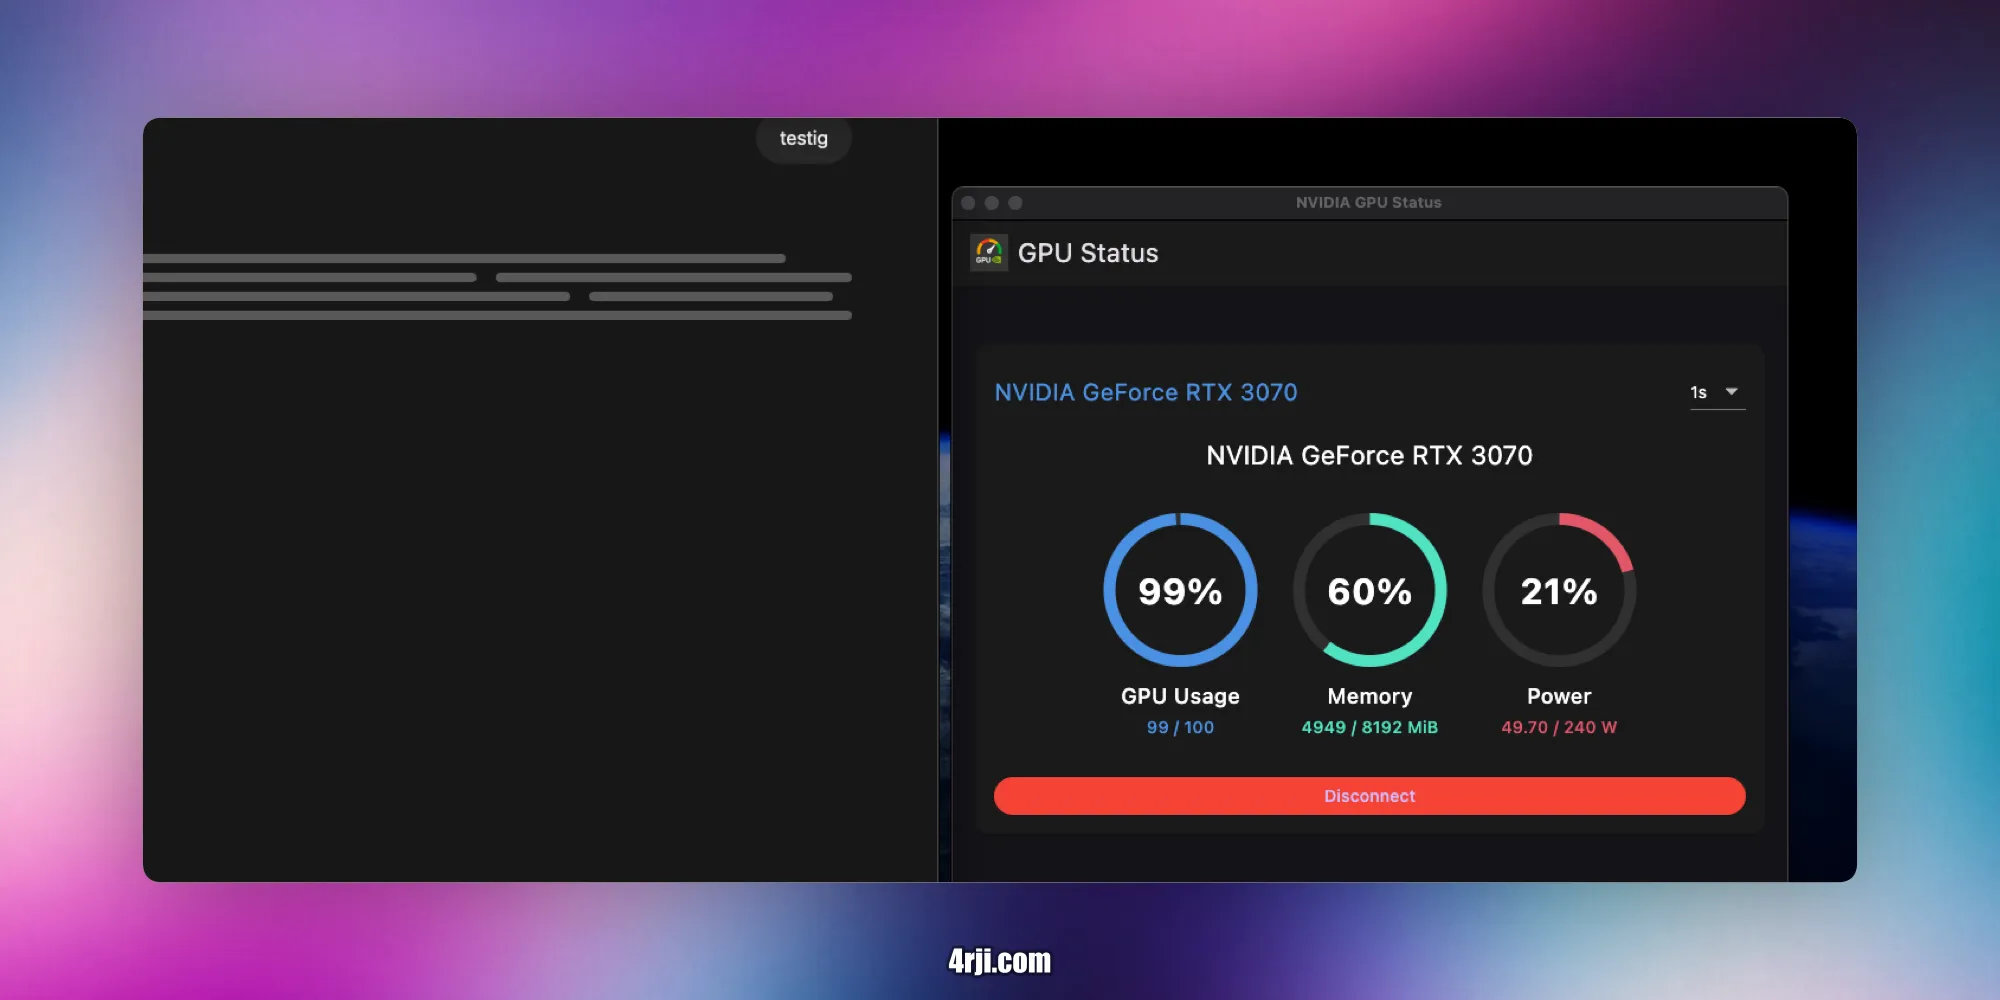
NVIDIA GPU Monitor
A real-time monitoring application for NVIDIA GPUs that provides a beautiful and intuitive interface to track GPU usage, memory consumption, and power usage.
Features
- Real-time monitoring of NVIDIA GPU metrics:
- GPU Usage (%)
- Memory Usage (MiB)
- Power Consumption (W)
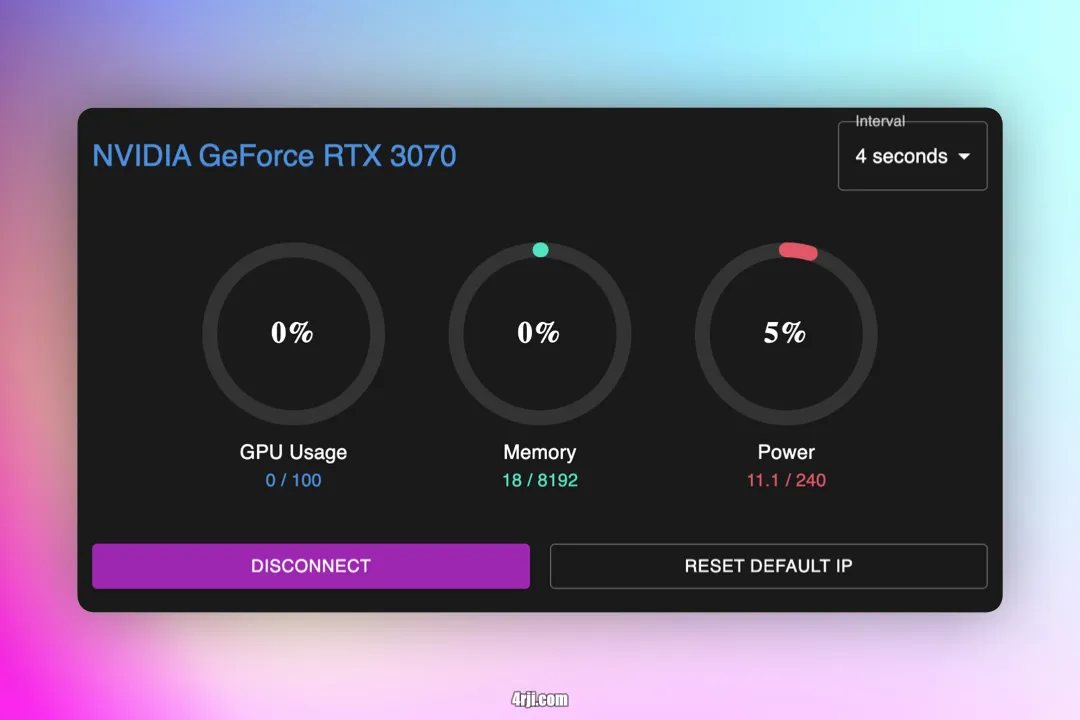
- Customizable refresh rate (1–10 seconds)
- Dark-themed interface with circular progress indicators
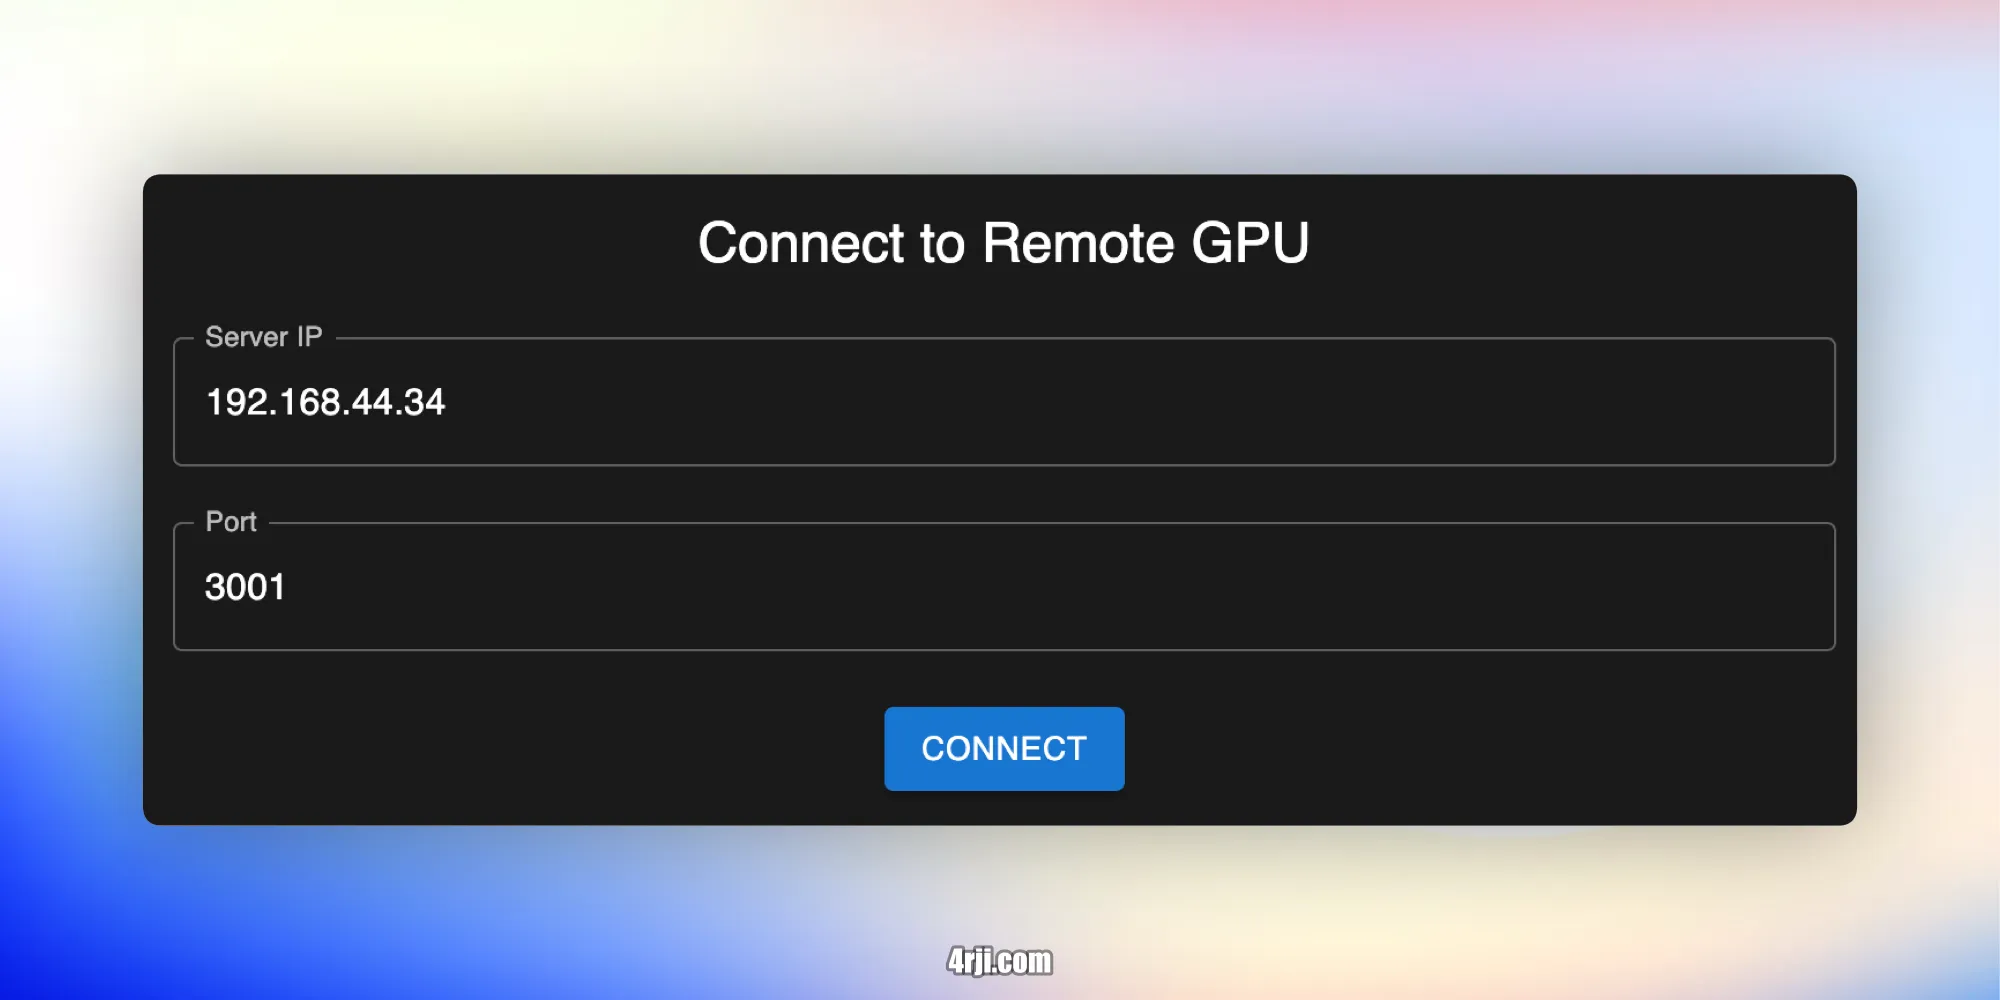
- Configurable server connection settings
- Cross-platform Electron application
Monitoring Features
- Refresh Rate: Select update intervals between 1–10 seconds
- GPU Metrics:
- Usage percentage (0–100%)
- Memory usage (Used/Total MiB)
- Power consumption (Current/Max Watts)
- Connection Controls:
- Disconnect/Reconnect
- Reset to default IP
Development
The application is built with:
- React + Vite for the frontend
- Electron for the desktop application
- Material-UI for the interface components
- Flask for the Python agent