
Project Overview & Setup
A complete guide to deploying the MQTT monitoring dashboard, configuring the Mosquitto broker, and streaming telemetry from Digi routers.
Quick Navigation
-
1
About the Project
This project is a web-based dashboard designed to monitor and display real-time telemetry data sent by Digi routers using the MQTT protocol.
MQTT (Message Queuing Telemetry Transport) is a lightweight publish-subscribe messaging network: remote devices publish messages to specific topics, and a central server known as an MQTT broker (Mosquitto) receives and routes these messages to subscribed clients. The web panel connects directly to this broker to present the router telemetry systematically.
Project Highlights
- Real-time MQTT telemetry visualization for Digi routers.
- Local Mosquitto broker setup to receive and distribute topics.
- Python web application handling message capture and SQLite storage.
- Dynamic dashboard displaying RAM, CPU load, and disk utilization.
- Responsive, auto-updating UI powered by server-sent events or WebSockets.
-
2
How It Works
The system operates in a sequential, high-speed telemetry flow:
- Telemetry Publish: A Digi router publishes a status or telemetry message to the broker.
- Broker Routing: The Mosquitto broker receives the message and publishes it to subscribers.
- Data Ingestion: A Python client script subscribes to all relevant topics and captures incoming data.
- Storage & State: Messages are temporarily held in-memory and can be persisted in a lightweight SQLite database for history.
- Live Update: The dashboard web interface displays updates instantly in real-time, eliminating the need to refresh.
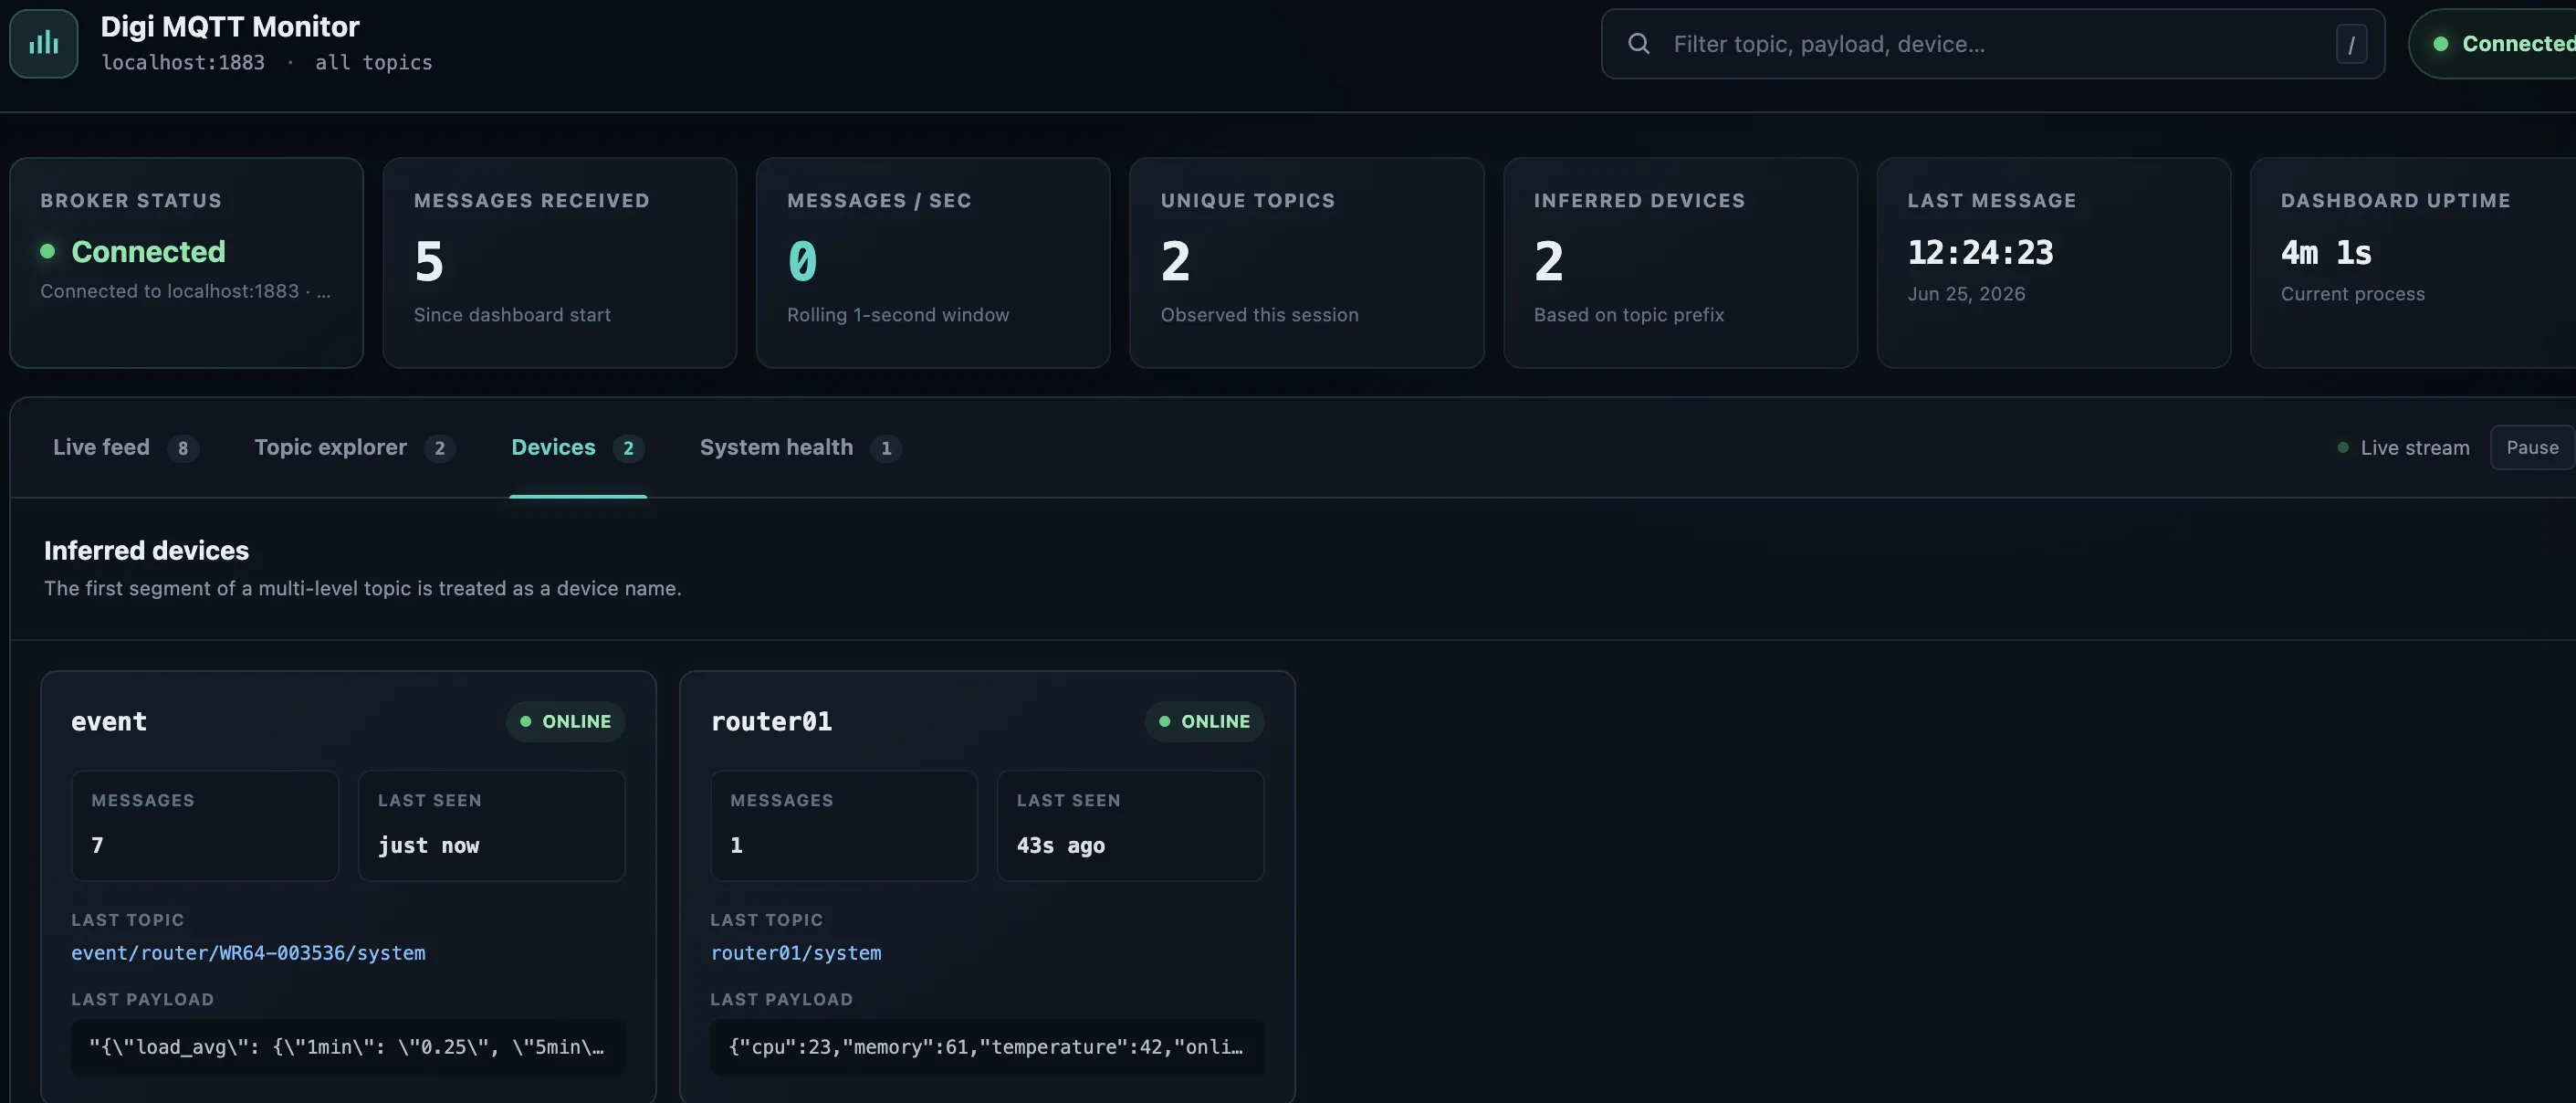
Devices are identified dynamically using the top-level segment of the topic. For instance, a message sent on
router01/statusis automatically mapped torouter01. -
3
Install and Configure Mosquitto
Follow these steps to set up the Mosquitto MQTT broker on your host machine:
1. Install Mosquitto
Install Mosquitto and its client tools using your local package manager (e.g.
apt,pacman):sudo apt update && sudo apt install -y mosquitto mosquitto-clients2. Review and Edit Configuration
Configure Mosquitto to listen on port 1883 and allow anonymous connections for simple testing. Edit the config file:
sudo nano /etc/mosquitto/mosquitto.confEnsure the config contains the following directives:
listener 1883
allow_anonymous true
3. Run Mosquitto in Verbose Mode for Debugging
For troubleshooting or viewing live transactions, run Mosquitto directly with verbose output:
mosquitto -v4. Verify the Broker Service
Check the status of the Mosquitto daemon/service:
ctl status mosquitto
# Or directly via systemctl:
sudo systemctl status mosquitto
5. Monitor Service Logs
Stream system logs for the broker service:
sudo journalctl -u mosquitto -f6. Inspect Live Port Traffic
Verify traffic flowing through port 1883 using tcpdump:
sudo tcpdump -i any port 18837. Define Environment Variables
Point clients to the MQTT broker host (localhost for local verification):
export MQTT_HOST=localhost8. Subscribe to Validate Telemetry Flow
Subscribe to all topics (wildcard
#) to confirm that messages are arriving successfully:mosquitto_sub -h localhost -t '#' -v -
4
Dashboard Features & Metrics
Once active, the dashboard provides visual tracking for several key variables:
- Broker Connection State: Live indicator of client connectivity with the Mosquitto broker.
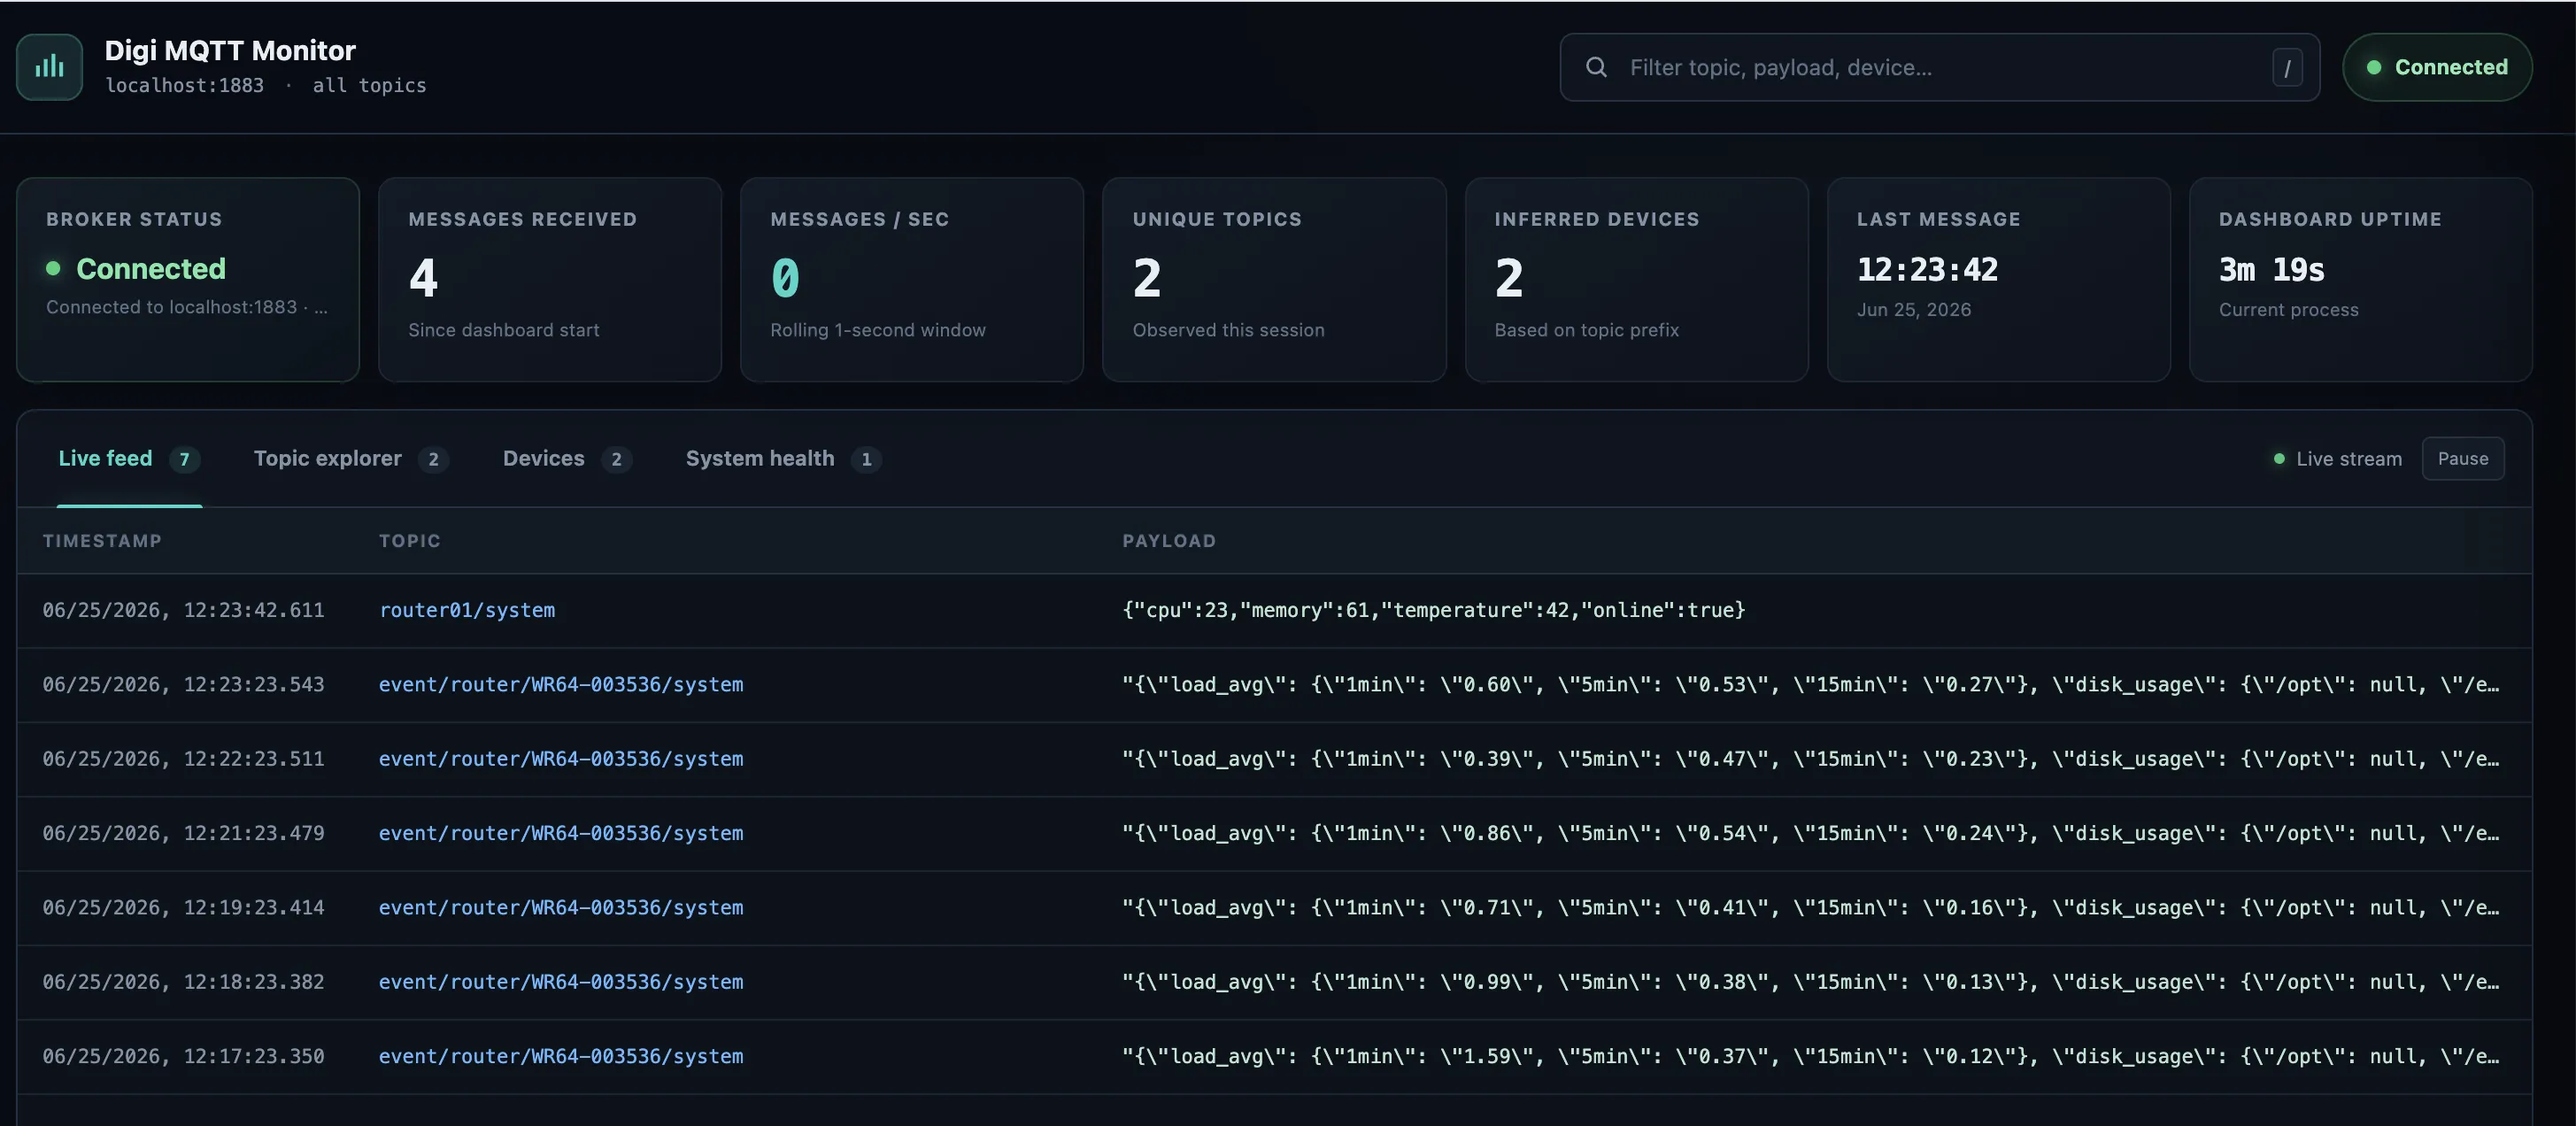
- Real-time Telemetry: Instant display of incoming messages.
- Aggregated Stats: Displays total message count, unique topics, and active devices.
- Payload Inspection: Deep dive into raw message contents.
- Last Communication: Time and date timestamps indicating when each router was last active.
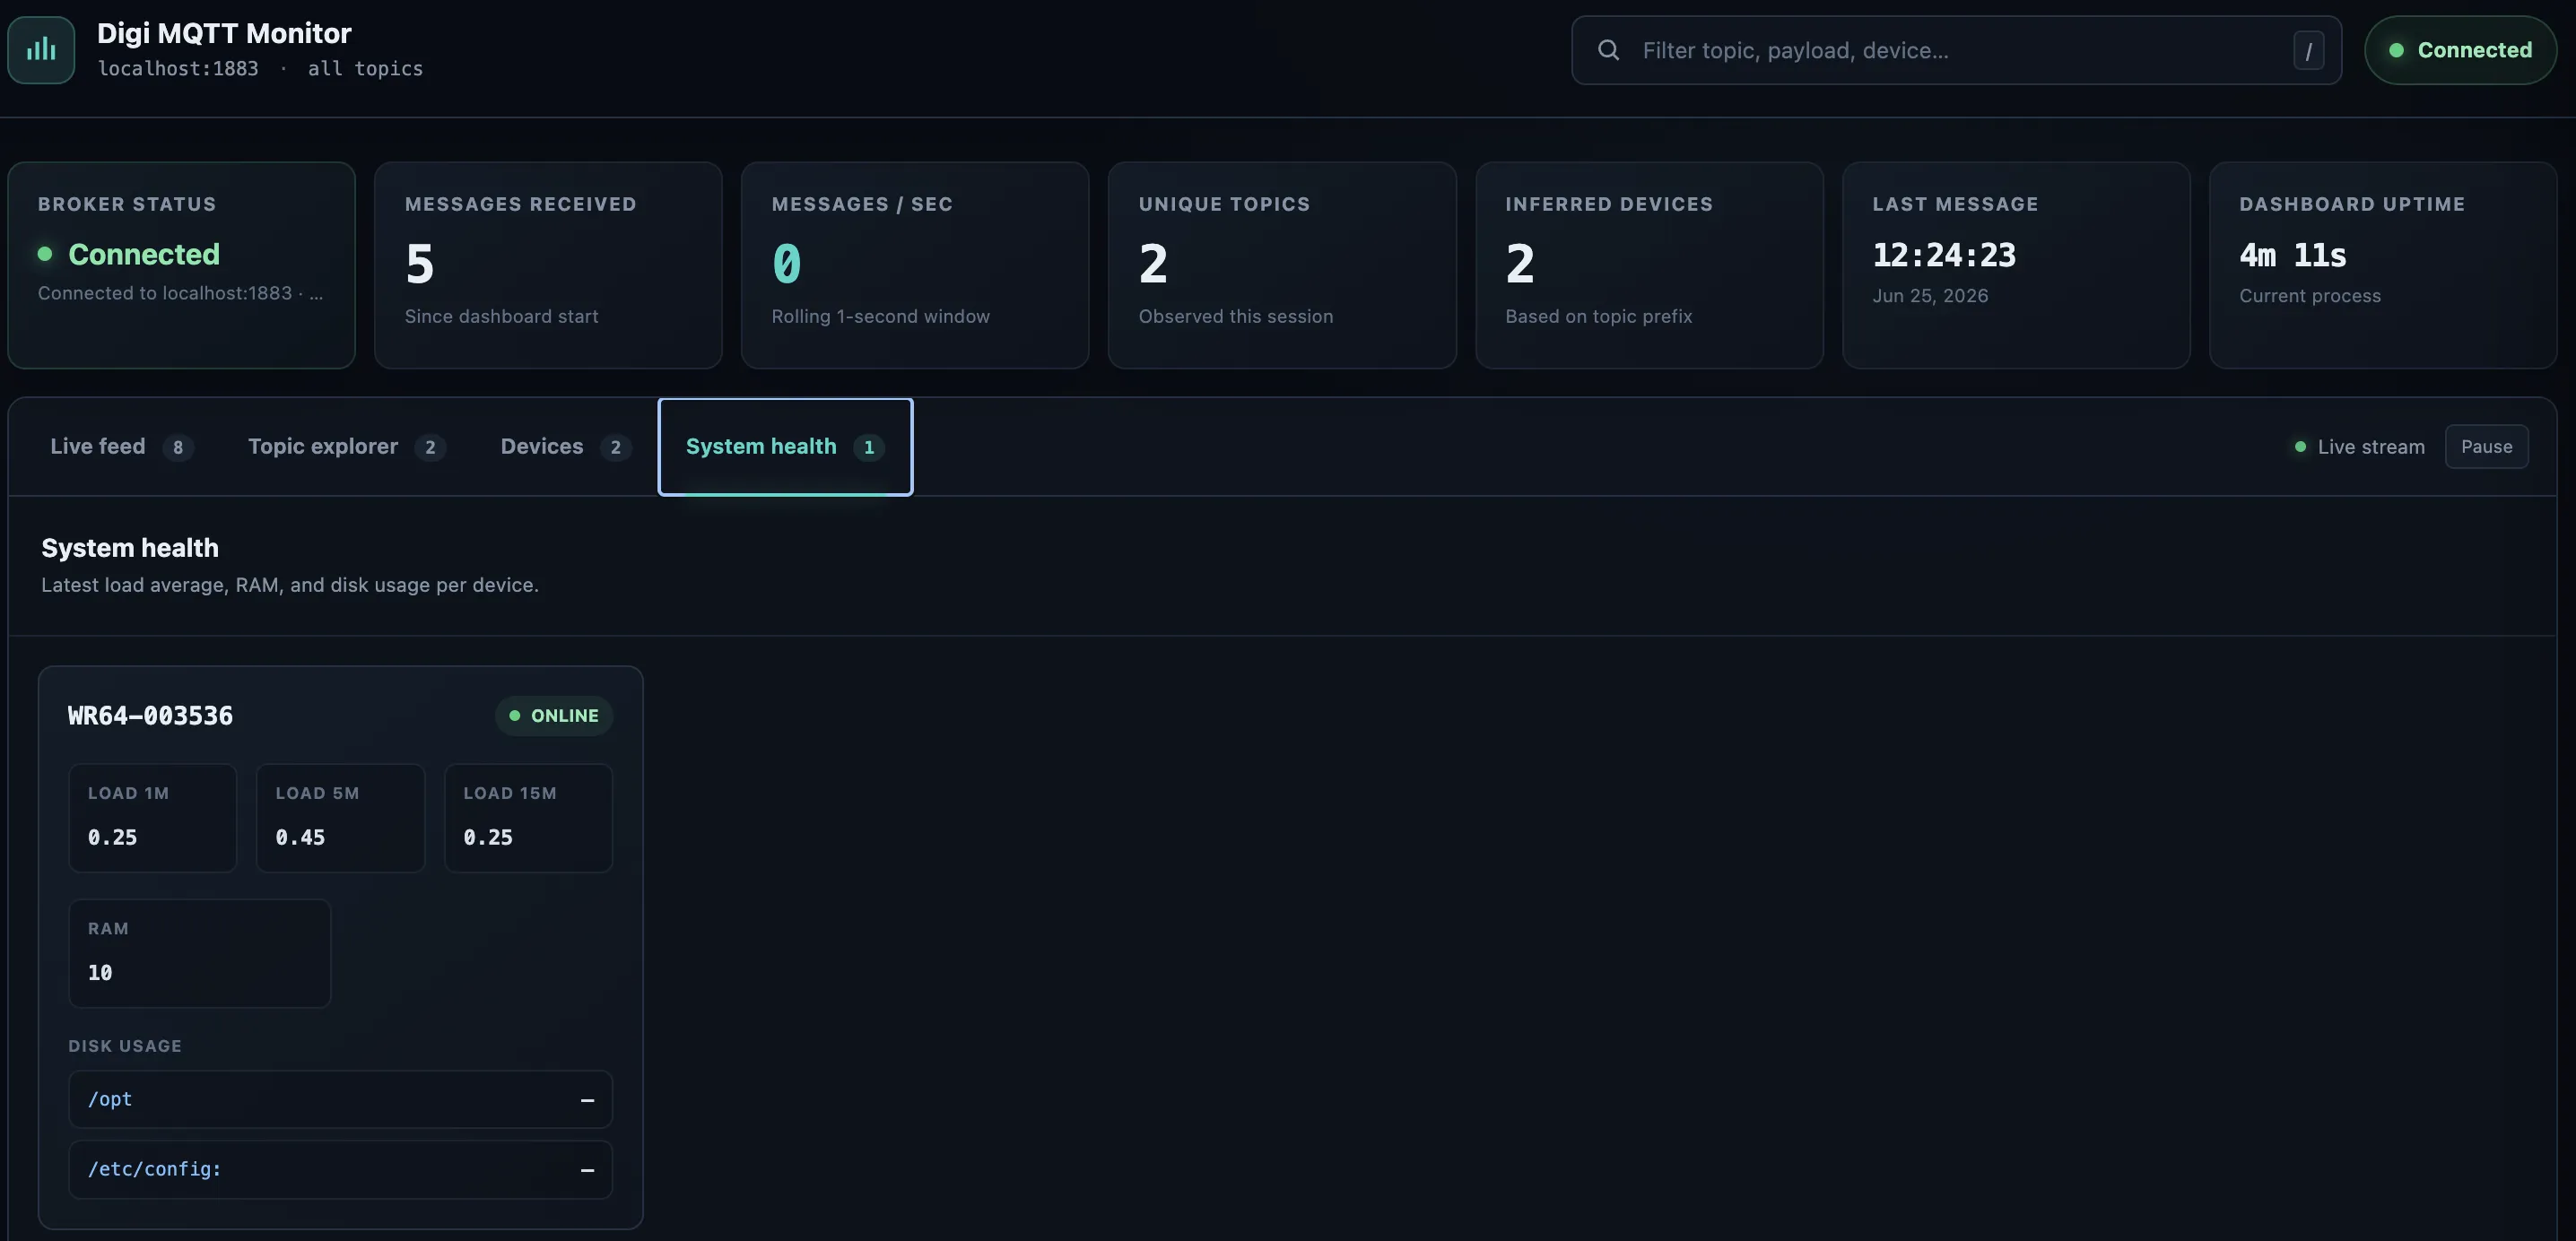
- System Performance: Local system metrics including CPU load, RAM usage, and disk volumes.
- SQLite History: Persistent logging of telemetry events.
Dashboard Screenshots
1. Device Overview Panel
2. System Health & Performance Metrics
3. Real-time Telemetry Logs
-
5
Run the Application
Main Project Components
app.py: The main web application script launching the server.mqtt_client.py: Handles callbacks, message queues, and broker connection.dashboard_state.py: Tracks active nodes, metrics, and message counts in-memory.message_store.py: Manages SQLite database creation, inserts, and history queries.templates/&static/: HTML/CSS/JS frontend assets.tests/: Unit tests validating the ingest and dashboard components.
1. Clone the Dashboard Repository
Clone the dashboard project from GitHub and navigate into the project directory:
git clone https://github.com/4rji/mosquitto-dash-mqtt.git
cd mosquitto-dash-mqtt
2. Install Dependencies
Set up a virtual environment and install dependencies listed in requirements.txt:
python3 -m venv .venv
source .venv/bin/activate
pip install -r requirements.txt
3. Configure Broker Host and Run
Export the broker's IP address (replace with your Mosquitto host IP, e.g.
10.10.65.42orlocalhost) and run:export MQTT_HOST=10.10.65.42 python app.pyFinally, open
http://localhost:5000in your browser.4. Containerized Deployment (Docker)
For isolated running and simple portability, run inside a Docker container:
docker build -t mqtt-dashboard .
docker run -d -p 5000:5000 -e MQTT_HOST=10.10.65.42 mqtt-dashboard