Grafana Setup Guide
Quick Installation on Mac
Install Grafana using Homebrew:
brew install grafana
Start the Grafana Service
brew services start grafana
Access Grafana
http://localhost:3000
Default credentials: admin / admin
Configuring Grafana
In Grafana (if you already have it installed):
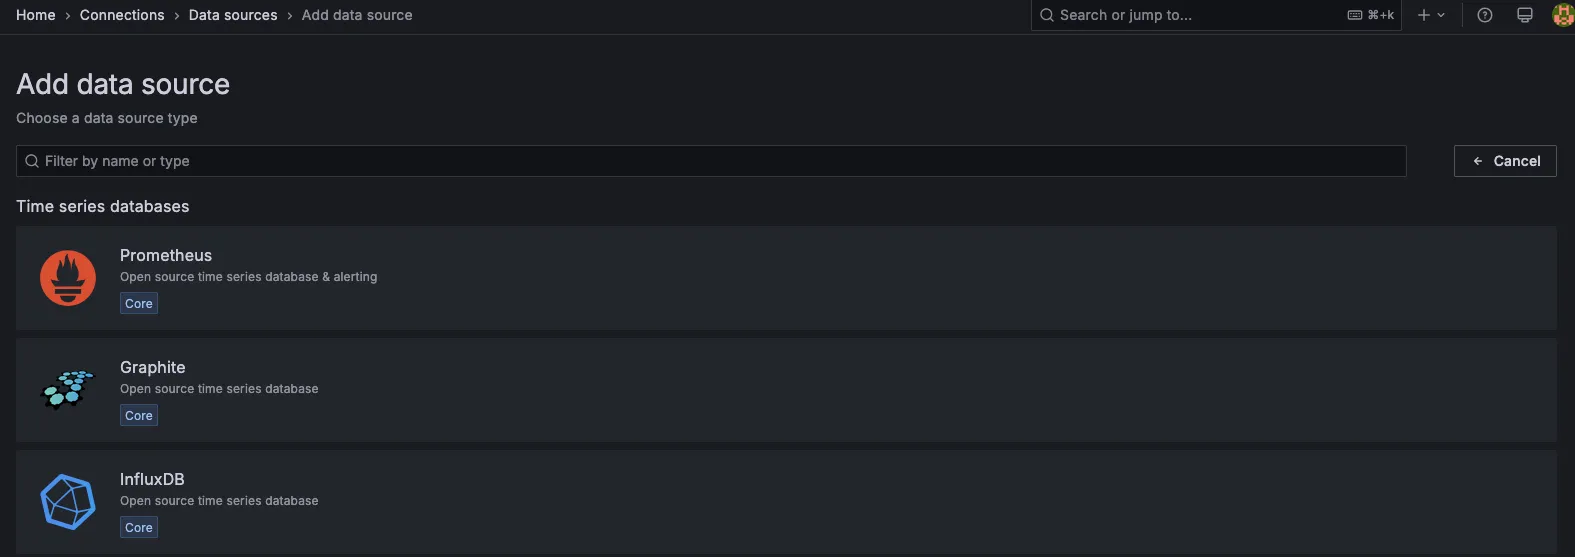
1. Add Prometheus Data Source
Go to Configuration → Data Sources → Add data source → Prometheus
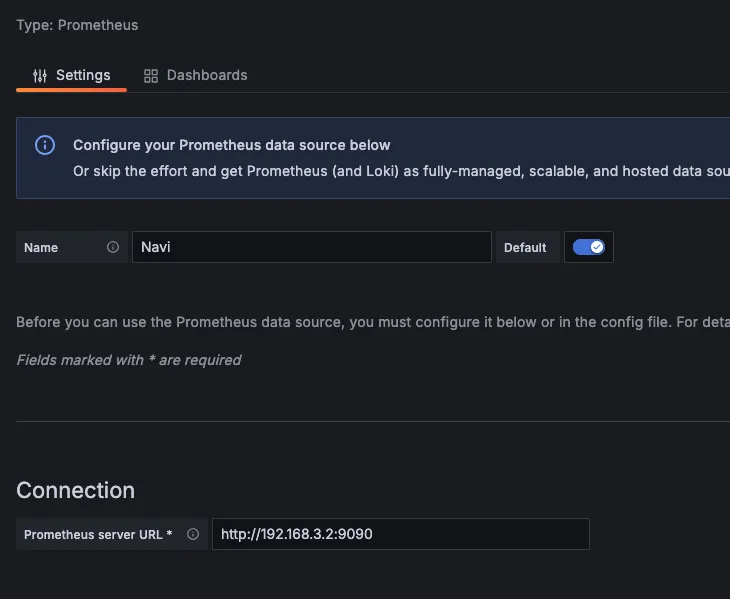
Set URL: http://192.168.3.2:9090 (or your Prometheus IP/port)
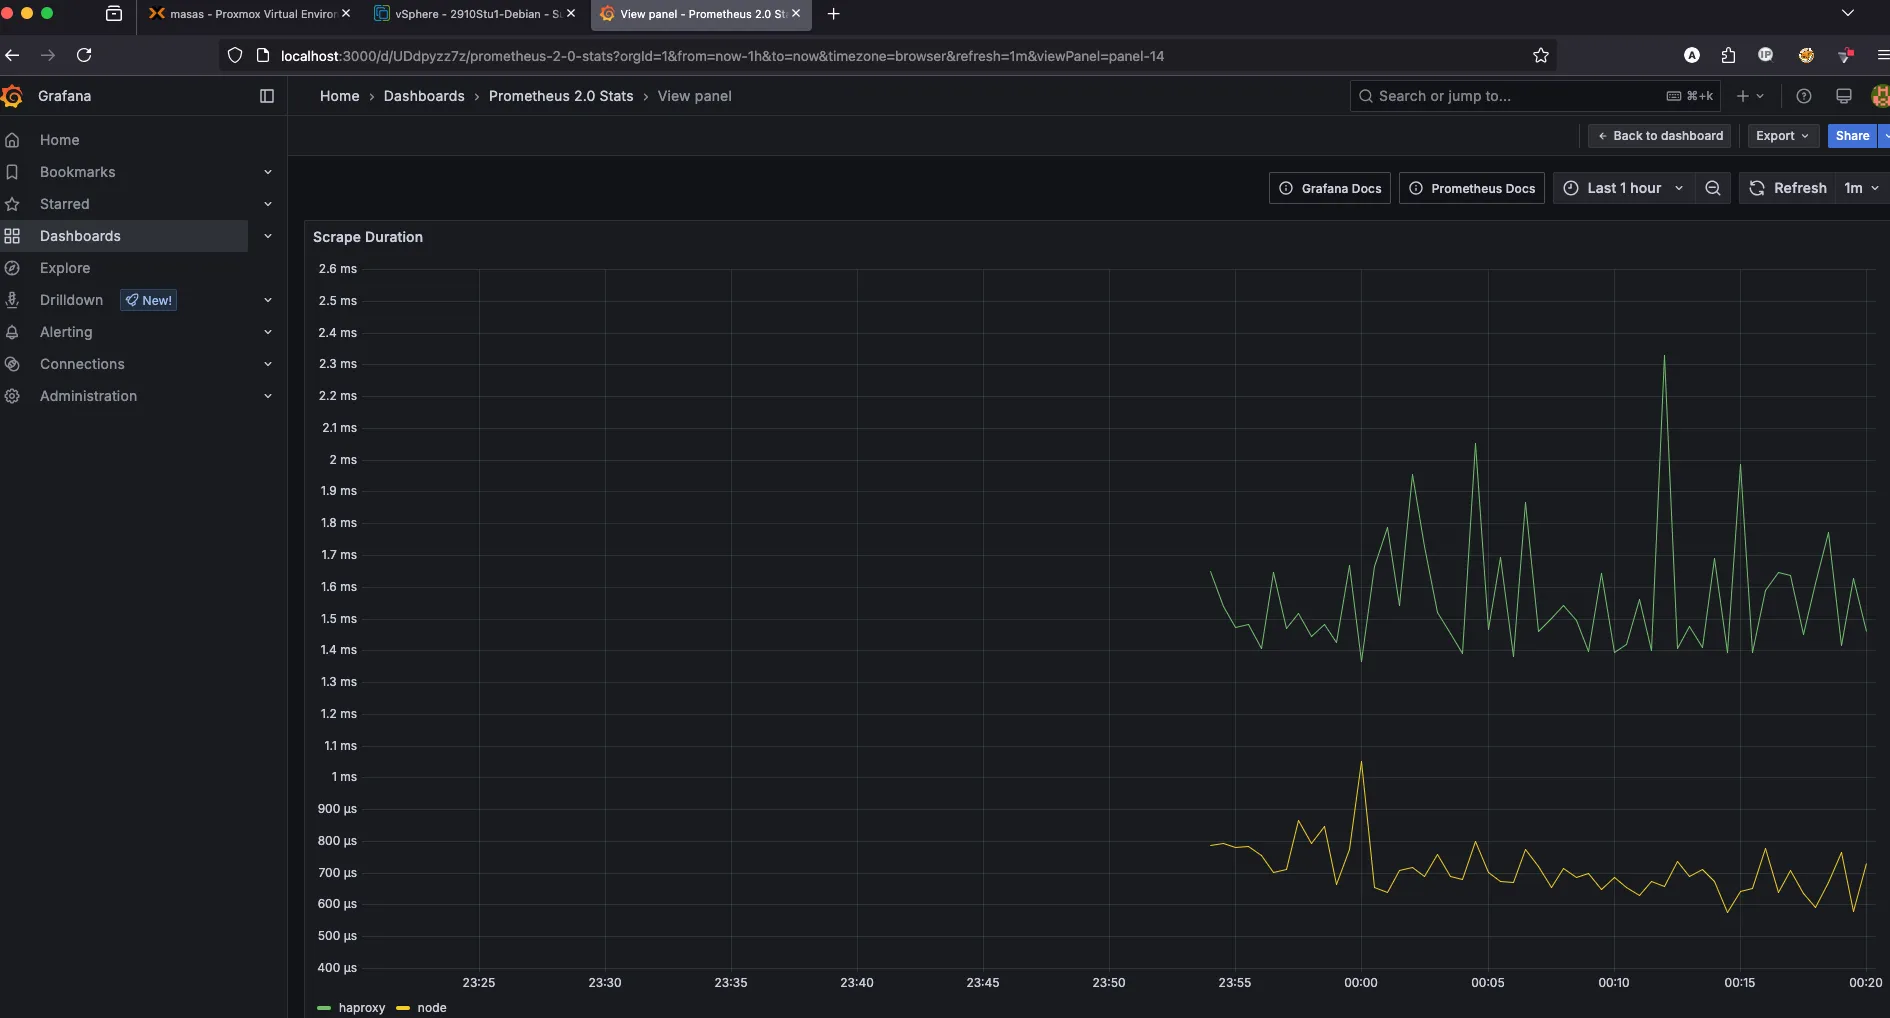
Importing HAProxy Dashboard
To import the official HAProxy dashboard:
1. Import Dashboard
Go to Create → Import
Enter dashboard ID: 7587
Assign your data source
If you don't have Prometheus installed, click here to go to the Prometheus configuration guide